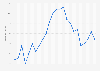
In the fiscal year of 2021, the revenue of the Virginia state and local government totaled to about 100.6 billion U.S. dollars. This is in comparison to expenditures worth about 104.65 billion U.S. dollars in that same fiscal year.
State and local government revenue and expenditure in Virginia in the United States from fiscal year 2004 to 2021 (in billion U.S. dollars)
Basic Account
Get to know the platform
You only have access to basic statistics.
This statistic is not included in your account.
Starter Account
The ideal entry-level account for individual users
- Instant access to 1m statistics
- Download in XLS, PDF & PNG format
- Detailed references
$149 USD / Month *
Professional Account
Full access
Business Solutions including all features.
* Prices do not include sales tax.
Other statistics that may interest you Virginia
Population
6
- Basic Statistic Population in the states of the U.S. 2022
- Premium Statistic Resident population in Virginia 1960-2022
- Premium Statistic Population share of Virginia 2022, by age group
- Basic Statistic Population of Virginia 2022, by race and ethnicity
- Premium Statistic Educational attainment in Virginia 2022
- Premium Statistic U.S. projected state population by state 2040
Economy
8
- Basic Statistic U.S. real gross domestic product 2022, by state
- Basic Statistic U.S. real GDP of Virginia 2000-2022
- Basic Statistic U.S. annual GDP growth in Virginia 2000-2022
- Basic Statistic U.S. real per capita GDP 2022, by state
- Basic Statistic U.S. real value added to GDP in Virginia 2022, by industry
- Premium Statistic U.S. number of business establishments in Virginia 2021, by industry
- Premium Statistic U.S. top companies in Virginia 2021, by revenue
- Premium Statistic U.S. Virginia fastest growing private companies 2022, by growth
Employment & Earnings
8
- Premium Statistic U.S. number of nonfarm employees in Virginia 2000-2022
- Premium Statistic U.S. number of nonfarm employees Virginia 2022, by industry
- Basic Statistic U.S. unemployment rate in Virginia 1992-2022
- Basic Statistic U.S. per capita personal income Virginia 2000-2022
- Basic Statistic U.S. Virginia median household income 1990-2022
- Premium Statistic U.S. average annual pay of employees in Virginia 2001-2022
- Premium Statistic U.S. per capita disposable personal income in Virginia 1990-2022
- Basic Statistic U.S. Virginia poverty rate 2000-2022
State & Local Government
3
Metro Areas
7
- Basic Statistic U.S. population of metropolitan areas in 2022
- Basic Statistic U.S. Consumer Price Index for selected U.S. cities 2022
- Basic Statistic U.S. real GDP 2021, by metro area
- Premium Statistic U.S. metro areas - ranked by Gross Metropolitan Product (GMP) 2021
- Premium Statistic U.S. Washington D.C. metro area GDP 2001-2021
- Basic Statistic Washington-Arlington-Alexandria metro area population in the U.S. 2010-2022
- Basic Statistic Richmond metro area population in the U.S. 2010-2022
Further related statistics
15
- U.S. California state and local government funding FY 2004-2021
- Michigan: state and local government funding 2004-2018
- Missouri: state and local government funding 2004-2018
- Monthly government deficit in the UK 1997-2021
- Central government income, expenditure and balance in Sweden 2013-2021
- Central government income in Sweden 2021, by type
- Forecast government expenditure as share of GDP in Belgium 2021-2028
- Central government expenditure in Sweden 2021, by area
- Government debt as share of GDP in Malaysia 2019-2022
- Types of non-developmental revenue expenditure of India's government 2018
- Government external debt in Qatar 2005-2018
- UK government net assets 2000-2020
- Allocated budget for Bucharest, Romania 2011-2021
- Alabama: state and local government funding 2004-2018
- Number of registered automobiles in Colorado 2016
Further Content: You might find this interesting as well
Statistics
- U.S. California state and local government funding FY 2004-2021
- Michigan: state and local government funding 2004-2018
- Missouri: state and local government funding 2004-2018
- Monthly government deficit in the UK 1997-2021
- Central government income, expenditure and balance in Sweden 2013-2021
- Central government income in Sweden 2021, by type
- Forecast government expenditure as share of GDP in Belgium 2021-2028
- Central government expenditure in Sweden 2021, by area
- Government debt as share of GDP in Malaysia 2019-2022
- Types of non-developmental revenue expenditure of India's government 2018
- Government external debt in Qatar 2005-2018
- UK government net assets 2000-2020
- Allocated budget for Bucharest, Romania 2011-2021
- Alabama: state and local government funding 2004-2018
- Number of registered automobiles in Colorado 2016
US Census Bureau. (June 29, 2023). State and local government revenue and expenditure in Virginia in the United States from fiscal year 2004 to 2021 (in billion U.S. dollars) [Graph]. In Statista. Retrieved December 03, 2023, from https://www.statista.com/statistics/590085/virginia-state-and-local-government-revenue-and-expenditure/
US Census Bureau. "State and local government revenue and expenditure in Virginia in the United States from fiscal year 2004 to 2021 (in billion U.S. dollars)." Chart. June 29, 2023. Statista. Accessed December 03, 2023. https://www.statista.com/statistics/590085/virginia-state-and-local-government-revenue-and-expenditure/
US Census Bureau. (2023). State and local government revenue and expenditure in Virginia in the United States from fiscal year 2004 to 2021 (in billion U.S. dollars). Statista. Statista Inc.. Accessed: December 03, 2023. https://www.statista.com/statistics/590085/virginia-state-and-local-government-revenue-and-expenditure/
US Census Bureau. "State and Local Government Revenue and Expenditure in Virginia in The United States from Fiscal Year 2004 to 2021 (in Billion U.S. Dollars)." Statista, Statista Inc., 29 Jun 2023, https://www.statista.com/statistics/590085/virginia-state-and-local-government-revenue-and-expenditure/
US Census Bureau, State and local government revenue and expenditure in Virginia in the United States from fiscal year 2004 to 2021 (in billion U.S. dollars) Statista, https://www.statista.com/statistics/590085/virginia-state-and-local-government-revenue-and-expenditure/ (last visited December 03, 2023)
State and local government revenue and expenditure in Virginia in the United States from fiscal year 2004 to 2021 (in billion U.S. dollars) [Graph], US Census Bureau, June 29, 2023. [Online]. Available: https://www.statista.com/statistics/590085/virginia-state-and-local-government-revenue-and-expenditure/