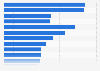
This statistic shows the results of a 2014 Popsugar survey among American women asking them if they prefer websites that have a great visual content, including images, videos, GIFs, etc. During the survey, 38.6 percent of female respondents said they agree somewhat.
Women: Do you prefer websites that have a great visual content, including images, videos, GIFs, etc.?
Basic Account
Get to know the platform
You only have access to basic statistics.
This statistic is not included in your account.
Starter Account
The ideal entry-level account for individual users
- Instant access to 1m statistics
- Download in XLS, PDF & PNG format
- Detailed references
$199 USD / Month *
Professional Account
Full access
Business Solutions including all features.
* Prices do not include sales tax.
Other statistics that may interest you Statistics on
About the industry
10
- Premium Statistic Women's viewing preference in fashion, beauty and style online content in 2014
- Premium Statistic U.S. parents on how often under-11 children watch YouTube 2020
- Premium Statistic Women who purchase products from brands that use high quality online visual content
- Premium Statistic Categories of women's favorite websites in 2014
- Premium Statistic Women's reasons websites become special to them in 2014
- Premium Statistic Women's ranking of an appealing design for a website that shows visual content
- Premium Statistic Women's ranking of vibrant colors for a website that shows visual content
- Premium Statistic Women's activities after seeing good online visual content in the U.S. in 2014
- Premium Statistic Women's reasons to stop visiting a website they used to visit for visual content
- Premium Statistic Internet usage for financial transactions in Japan 2022, by age group and gender
About the region
10
- Premium Statistic Women's preference of online ads that use original photography in the U.S. in 2014
- Premium Statistic Revenue growth of video advertising in the U.S. 2019-2028
- Premium Statistic Most popular platforms used to watch live streams in the U.S. 2022, by age group
- Basic Statistic Leading U.S. video properties 2023, by reach
- Premium Statistic Digital video advertising spending in the U.S. 2019-2023
- Premium Statistic Programmatic video ad spend in the U.S. 2021, by device
- Basic Statistic Most popular entertainment apps in the U.S. 2019, by reach
- Premium Statistic Share of subscription OTT viewers in the U.S. 2019-2023
- Premium Statistic Upfront digital video advertising spend in the U.S. 2016-2020
- Premium Statistic Top disadvantages of SVoD services in 2019
Other regions
10
- Premium Statistic Video market size in MENA by type 2017
- Premium Statistic Digital ad spend growth in South Africa 2020, by format
- Premium Statistic Share of individuals who watched videos in Norway 2008-2022
- Premium Statistic Online video: market penetration in Asia Pacific in June 2012
- Premium Statistic Combined 3G and 4G latency experience in India 2018 by service provider
- Premium Statistic Ranking of most used online video platforms in Finland 2018
- Premium Statistic Romania: number of UPC video subscribers 2012-2019
- Premium Statistic Preference for visual content over text content among Generation Z South Korea 2019
- Premium Statistic On-demand audiovisual services in Iceland 2019, by genre
- Premium Statistic Mobile video ad spend as share of total video ad spend in China 2015-2023
Related statistics
10
- Premium Statistic Women's facial moisturizer brand preferences in the U.S. 2016, by age group
- Premium Statistic Women's satisfaction with their personal relationships/social life in the U.S.
- Premium Statistic Women who currently own or plan to purchase smart jewelry in 2014
- Premium Statistic Number of hours U.S. women spend on food/cooking on an average day in 2014
- Premium Statistic Women's satisfaction with having people like or share their social media posts
- Premium Statistic Brands ways to communicate with women and enhance their happiness in the U.S. in 2014
- Premium Statistic Women's opinion on the influence of social media on their searching behaviour in 2014
- Premium Statistic Women's interest in fashion, beauty and style in the U.S. in 2014
- Premium Statistic Women's satisfaction with their looks/appearance in the U.S. in 2014
- Premium Statistic Women who currently own or plan to purchase smart clothing in 2014
Further related statistics
5
- Breakdown of U.S. online ad revenue 2023, by format
- Retail video market: consumer spending on physical video in France 2008-2022
- U.S. population without health care visits 1997-2018, by gender
- Adults with severe headache or migraine 1997-2016, by gender
- Consumers' likelihood of choosing soft drinks in the UK 2012, by gender
Further Content: You might find this interesting as well
Statistics
- Breakdown of U.S. online ad revenue 2023, by format
- Retail video market: consumer spending on physical video in France 2008-2022
- U.S. population without health care visits 1997-2018, by gender
- Adults with severe headache or migraine 1997-2016, by gender
- Consumers' likelihood of choosing soft drinks in the UK 2012, by gender
PopSugar. (January 31, 2015). Women: Do you prefer websites that have a great visual content, including images, videos, GIFs, etc.? [Graph]. In Statista. Retrieved April 20, 2024, from https://www.statista.com/statistics/594850/preference-of-websites-that-have-a-great-visual-content-in-the-us/
PopSugar. "Women: Do you prefer websites that have a great visual content, including images, videos, GIFs, etc.?." Chart. January 31, 2015. Statista. Accessed April 20, 2024. https://www.statista.com/statistics/594850/preference-of-websites-that-have-a-great-visual-content-in-the-us/
PopSugar. (2015). Women: Do you prefer websites that have a great visual content, including images, videos, GIFs, etc.?. Statista. Statista Inc.. Accessed: April 20, 2024. https://www.statista.com/statistics/594850/preference-of-websites-that-have-a-great-visual-content-in-the-us/
PopSugar. "Women: Do You Prefer Websites That Have a Great Visual Content, including Images, Videos, Gifs, Etc.?." Statista, Statista Inc., 31 Jan 2015, https://www.statista.com/statistics/594850/preference-of-websites-that-have-a-great-visual-content-in-the-us/
PopSugar, Women: Do you prefer websites that have a great visual content, including images, videos, GIFs, etc.? Statista, https://www.statista.com/statistics/594850/preference-of-websites-that-have-a-great-visual-content-in-the-us/ (last visited April 20, 2024)
Women: Do you prefer websites that have a great visual content, including images, videos, GIFs, etc.? [Graph], PopSugar, January 31, 2015. [Online]. Available: https://www.statista.com/statistics/594850/preference-of-websites-that-have-a-great-visual-content-in-the-us/