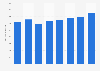
This statistic looks at product recalls in the United Kingdom (UK) from January 2016 to the end of December of 2021. The statistic shows that 2020 saw the most recalls on products with 255 total recalls.
Number of products recalled per year in the United Kingdom (UK) from 2016 to 2021 (non food or drink)
Basic Account
Get to know the platform
You only have access to basic statistics.
This statistic is not included in your account.
Starter Account
The ideal entry-level account for individual users
- Instant access to 1m statistics
- Download in XLS, PDF & PNG format
- Detailed references
$69 USD $49 USD / Month *
in the first 12 months
Professional Account
Full access
Business Solutions including all features.
* Prices do not include sales tax.
Other statistics that may interest you
Overview
8
- Premium Statistic Free-from food sales forecast in the United Kingdom (UK) from 2010 to 2020
- Premium Statistic Share of spend on free-from food categories in the United Kingdom (UK) in 2016
- Premium Statistic Share of consumers who have bought or eaten free-from foods United Kingdom (UK) 2016
- Premium Statistic Share of population consuming free-from foods in the United Kingdom (UK) 2014-2016
- Premium Statistic Frequency of buying free from products in the United Kingdom (UK) in 2015 and 2016
- Premium Statistic Reasons for buying free-from food and drink in the United Kingdom (UK) in 2015
- Premium Statistic Changes to free-from consumers shopping habits in the United Kingdom (UK) in 2015
- Premium Statistic Leading websites covering free-from nutrition in the UK 2018, by share of voice
Gluten-free
7
- Premium Statistic Gluten-free per capita spending forecast in leading markets in Europe 2015-2020
- Premium Statistic Sales value of the free-from bakery market United Kingdom (UK) 2015-2016, by product
- Premium Statistic Retailer market share of the free-from bakery category United Kingdom (UK) 2016
- Premium Statistic Eating habits relating to gluten consumption in the United Kingdom (UK) in 2015
- Premium Statistic Reasons for reduction in gluten intake United Kingdom (UK) in 2015
- Premium Statistic Perceived health benefits of reduction in gluten intake United Kingdom (UK) in 2015
- Premium Statistic Gluten-free product categories purchased in the United Kingdom (UK) in 2015
Dairy-free
7
- Premium Statistic Share of lactose or dairy free diet followers worldwide 2016, by region
- Premium Statistic Volume of milk alternatives sold in Great Britain 2012-2016
- Premium Statistic Market share of dairy-free milk industry United Kingdom (UK) in 2016, based on value
- Premium Statistic Eating habits relating to dairy in the United Kingdom (UK) in 2015
- Premium Statistic Reasons for reduction in dairy intake in the United Kingdom (UK) in 2015
- Premium Statistic Perceived health benefits of reduction in dairy intake United Kingdom (UK) in 2015
- Premium Statistic Dairy- / lactose-free product categories purchased United Kingdom (UK) in 2015
Consumer insights
8
- Premium Statistic Consumer attitudes to free-from foods in the United Kingdom (UK) 2016
- Premium Statistic Awareness of free-from food ranges in the United Kingdom (UK) in 2015
- Premium Statistic Reasons why free-from foods are considered to be healthier United Kingdom (UK) 2015
- Premium Statistic Consumer opinions on free-from food production costs in the United Kingdom 2015
- Premium Statistic Consumer opinions on free-from food prices in the United Kingdom 2015
- Premium Statistic Consumer satisfaction with dairy or lactose free-from ranges United Kingdom 2015
- Premium Statistic Consumer satisfaction with gluten-free free-from ranges United Kingdom (UK) in 2015
- Premium Statistic Reasons why consumers buy fewer free-from products than six months ago UK 2015
Allergies and intolerances
6
- Premium Statistic Reasons for a suspected food allergy or intolerance United Kingdom (UK) in 2015
- Premium Statistic Gluten consumption and presence of any sensitivity United Kingdom (UK) in 2015
- Premium Statistic Dairy consumption and presence of any sensitivity United Kingdom (UK) in 2015
- Premium Statistic Demographics of free-from food consumers in the United Kingdom (UK) in 2015
- Premium Statistic Purchase drivers for free-from foods in the United Kingdom (UK) in 2015
- Premium Statistic Consumer trust of potential gluten-free symbols United Kingdom (UK) in 2015
Further related statistics
1
Further Content: You might find this interesting as well
OECD. (June 29, 2022). Number of products recalled per year in the United Kingdom (UK) from 2016 to 2021 (non food or drink) [Graph]. In Statista. Retrieved May 31, 2023, from https://www.statista.com/statistics/596667/number-of-products-recalled-each-year-in-the-united-kingdom/
OECD. "Number of products recalled per year in the United Kingdom (UK) from 2016 to 2021 (non food or drink)." Chart. June 29, 2022. Statista. Accessed May 31, 2023. https://www.statista.com/statistics/596667/number-of-products-recalled-each-year-in-the-united-kingdom/
OECD. (2022). Number of products recalled per year in the United Kingdom (UK) from 2016 to 2021 (non food or drink). Statista. Statista Inc.. Accessed: May 31, 2023. https://www.statista.com/statistics/596667/number-of-products-recalled-each-year-in-the-united-kingdom/
OECD. "Number of Products Recalled per Year in The United Kingdom (Uk) from 2016 to 2021 (Non Food or Drink)." Statista, Statista Inc., 29 Jun 2022, https://www.statista.com/statistics/596667/number-of-products-recalled-each-year-in-the-united-kingdom/
OECD, Number of products recalled per year in the United Kingdom (UK) from 2016 to 2021 (non food or drink) Statista, https://www.statista.com/statistics/596667/number-of-products-recalled-each-year-in-the-united-kingdom/ (last visited May 31, 2023)
Number of products recalled per year in the United Kingdom (UK) from 2016 to 2021 (non food or drink) [Graph], OECD, June 29, 2022. [Online]. Available: https://www.statista.com/statistics/596667/number-of-products-recalled-each-year-in-the-united-kingdom/