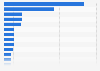
Plane crashes - jet hull loss rate by region 2018
The statistic shows the global jet hull loss rate in commercial aviation in 2018, with a breakdown by region. The Commonwealth of Independent States was the worst region in terms of safety performance, with 1.19 jet accidents per one million flights happening in 2018.
Aircraft hull loss rate per million flights in 2018, by region
(in units)
Loading statistic...
Basic Account
Get to know the platform
You only have access to basic statistics.
Premium Account
Your perfect start with Statista
- Instant access to 1m statistics
- Download in XLS, PDF & PNG format
- Detailed references
$59 / Month *
Corporate Account
Full access
Corporate solution including all features.
* All products require an annual contract.
Prices do not include sales tax.
Further Content: You might find this interesting as well
Statistics
- Business aircraft deliveries worldwide - converted airliners 2018-2027
- Number of first officers employed by air cargo companies China 2018, by type rating
- Business aircraft purchases: selected countries worldwide 2012
- Business aircraft deliveries worldwide - super light jets 2018-2027
- Cost of major hull claims for western built jets worldwide 2005-2014
- Business aircraft deliveries worldwide - midsize jets 2018-2027
- Business aircraft deliveries worldwide - super midsize jets 2018-2027
- Business aircraft deliveries worldwide - large jets 2018-2027
- Business aircraft deliveries worldwide - super large jets 2018-2027
- Business aircraft deliveries worldwide - ultra long range jets 2018-2027
- Aircraft types with the the largest number of casualties until 2011
- Number of Boeing 737 Max 8 in operation in Indonesia 2019 by airline
- Commercial flights in U.S. - large bird strikes 2000-2015
- Ordered amount of A320 aircraft
Further related statistics
IATA. (June 1, 2019). Aircraft hull loss rate per million flights in 2018, by region (in units) [Graph]. In Statista. Retrieved December 16, 2019, from https://www.statista.com/statistics/602675/global-jet-hull-lossaccident-rate-commercial-aviation/
IATA. "Aircraft hull loss rate per million flights in 2018, by region (in units)." Chart. June 1, 2019. Statista. Accessed December 16, 2019. https://www.statista.com/statistics/602675/global-jet-hull-lossaccident-rate-commercial-aviation/
IATA. (2019). Aircraft hull loss rate per million flights in 2018, by region (in units). Statista. Statista Inc.. Accessed: December 16, 2019. https://www.statista.com/statistics/602675/global-jet-hull-lossaccident-rate-commercial-aviation/
IATA. "Aircraft Hull Loss Rate per Million Flights in 2018, by Region (in Units)." Statista, Statista Inc., 1 Jun 2019, https://www.statista.com/statistics/602675/global-jet-hull-lossaccident-rate-commercial-aviation/
IATA, Aircraft hull loss rate per million flights in 2018, by region (in units) Statista, https://www.statista.com/statistics/602675/global-jet-hull-lossaccident-rate-commercial-aviation/ (last visited December 16, 2019)