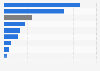
This statistic displays adult attitudes towards living now compared to twenty years in the future in the United Kingdom (UK) in 2016. A majority of 65 percent of adult respondents reported they would prefer to live in today's world when compared to the world in twenty years' times.
Share of attitudes towards living now compared to twenty years in future in the United Kingdom (UK) in 2016*
Loading statistic...
Basic Account
Get to know the platform
You only have access to basic statistics.
Starter Account
The ideal entry-level account for individual users
- Instant access to 1m statistics
- Download in XLS, PDF & PNG format
- Detailed references
$199 USD / Month *
Professional Account
Full access
Business Solutions including all features.
* Prices do not include sales tax.
Other statistics that may interest you Statistics on
About the industry
10
- Premium Statistic Prefectures with the best local cuisine in Japan 2022
- Premium Statistic Most livable prefectures in Japan 2021
- Premium Statistic Public optimism and pessimism regarding the future of the EU from 2007 to 2018
- Premium Statistic Share of Japanese who find passive smoking unpleasant 2022
- Premium Statistic Prefectures with the most docile residents in Japan 2020
- Premium Statistic Opinions on opening borders during COVID-19 in Denmark 2020
- Premium Statistic Prefectures with the most obstinate residents in Japan 2019
- Premium Statistic Main challenges faced by U.S. consumers when redecorating a room in their home 2018
- Premium Statistic Satisfaction of foreigners living in Seoul South Korea 2016, by visa
- Premium Statistic Life in Seoul difficulties for foreigners South Korea 2016, by factor
About the region
10
- Premium Statistic Level of life satisfaction in cities in the United Kingdom (UK) 2017
- Premium Statistic Happiest cities in the United Kingdom (UK) 2017
- Premium Statistic Consequences of future technology innovation in the UK 2016
- Basic Statistic Percentage of young adults living with their parents UK 2022, by age and gender
- Basic Statistic Number and percentage of young adults living with their parents UK 1996-2022
- Premium Statistic Accuracy or bias of search engine results in the United Kingdom (UK) 2012-2022
- Premium Statistic Top eSports games in the UK 2022
- Premium Statistic Main characteristics typical of Arsenal FC in the UK 2021
- Premium Statistic Main characteristics typical of Chelsea FC in the UK 2021
- Premium Statistic Main characteristics typical of Tottenham Hotspur in the UK 2018
Other regions
10
- Premium Statistic Breakdown of people with disabilities in France 2020, by professional status
- Premium Statistic Public opinion on the financial future in selected European countries in 2019
- Premium Statistic Reasons to be positive about direct living environment in the Netherlands 2018
- Premium Statistic The 20 richest places in the U.S. 2015
- Premium Statistic Feeling in control of their lives as a source of happiness among Chinese 2020
- Premium Statistic Total population Cambodia 2015-2040
- Premium Statistic Share of residents optimistic about future GCC 2019
- Premium Statistic Society and culture predictions for 2020 in Spain
- Premium Statistic Society and culture predictions for 2020 in Belgium
- Premium Statistic Gini coefficient in Nigeria 2019, by area
Related statistics
10
- Premium Statistic Reasons to be negative about direct living environment in the Netherlands 2018
- Premium Statistic Living standards of young adults and their parents at the same age in the U.S.
- Premium Statistic Society and culture predictions for 2020 in the Netherlands
- Premium Statistic Opinions on lives young people today compared to the past in the Netherlands 2019
- Basic Statistic Distribution of Italians aged 18-34 years living in a shared dwelling 2018
- Basic Statistic Italy: share of young Italians living with their parents in 2018, by age group
- Basic Statistic Italy: share of young Italians living with their parents 2018, by occupational status
- Basic Statistic Individuals who love to try new things as soon as possible in the UK in 2017
- Basic Statistic Individuals who feel that the pace of innovation is increasing in the UK in 2017
- Basic Statistic Individuals who feel that the pace of innovation is decreasing in the UK in 2017
Further Content: You might find this interesting as well
Nesta. (April 26, 2016). Share of attitudes towards living now compared to twenty years in future in the United Kingdom (UK) in 2016* [Graph]. In Statista. Retrieved April 25, 2024, from https://www.statista.com/statistics/605532/attitudes-towards-living-now-compared-to-the-future-uk/
Nesta. "Share of attitudes towards living now compared to twenty years in future in the United Kingdom (UK) in 2016*." Chart. April 26, 2016. Statista. Accessed April 25, 2024. https://www.statista.com/statistics/605532/attitudes-towards-living-now-compared-to-the-future-uk/
Nesta. (2016). Share of attitudes towards living now compared to twenty years in future in the United Kingdom (UK) in 2016*. Statista. Statista Inc.. Accessed: April 25, 2024. https://www.statista.com/statistics/605532/attitudes-towards-living-now-compared-to-the-future-uk/
Nesta. "Share of Attitudes towards Living Now Compared to Twenty Years in Future in The United Kingdom (Uk) in 2016*." Statista, Statista Inc., 26 Apr 2016, https://www.statista.com/statistics/605532/attitudes-towards-living-now-compared-to-the-future-uk/
Nesta, Share of attitudes towards living now compared to twenty years in future in the United Kingdom (UK) in 2016* Statista, https://www.statista.com/statistics/605532/attitudes-towards-living-now-compared-to-the-future-uk/ (last visited April 25, 2024)
Share of attitudes towards living now compared to twenty years in future in the United Kingdom (UK) in 2016* [Graph], Nesta, April 26, 2016. [Online]. Available: https://www.statista.com/statistics/605532/attitudes-towards-living-now-compared-to-the-future-uk/