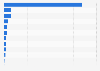
In fiscal year 2021, the import value of Japanese technology trade by business enterprises increased by about 10.8 percent compared to the previous year. As a result, the technology trade imports of business enterprises
Annual growth rate of technology trade import value by business enterprises in Japan from fiscal year 2012 to 2021
Basic Account
Get to know the platform
You only have access to basic statistics.
This statistic is not included in your account.
Starter Account
The ideal entry-level account for individual users
- Instant access to 1m statistics
- Download in XLS, PDF & PNG format
- Detailed references
$149 USD / Month *
Professional Account
Full access
Business Solutions including all features.
* Prices do not include sales tax.
Other statistics that may interest you Statistics on
About the industry
10
- Premium Statistic Import value of technology trade by business enterprises Japan FY 2012-2021
- Premium Statistic Technology trade export value growth rate by business enterprises Japan FY 2012-2021
- Premium Statistic Share of technology trade import value Japan FY 2021, by country of origin
- Premium Statistic Exports value of technology trade by business enterprises Japan FY 2012-2021
- Premium Statistic Share of technology trade export value Japan FY 2021, by destination
- Premium Statistic Spending on tech goods and services Asia 2019, by country
- Premium Statistic Export value of industrial electronic equipment Japan 2010-2018
- Premium Statistic Most growing technology companies in Finland 2017, by revenue change
- Premium Statistic Least growing technology companies in Finland 2017, by revenue change
- Premium Statistic London Stock Exchange (UK): technology companies listed 2018-2023
About the region
10
- Premium Statistic Annual growth rate of telecommunications systems imports value Japan 2010-2018
- Premium Statistic Annual growth rate of electronic business machines imports value Japan 2010-2018
- Premium Statistic Annual growth rate of electronic components imports value Japan 2010-2018
- Premium Statistic Commodity export value from Japan to Asia 2020, by region
- Premium Statistic Value of high-technology exports Japan 2012-2021
- Premium Statistic Manufactured goods export value from Japan to Asia 2018, by region
- Premium Statistic Cereals import value to Japan from Asia 2018, by region
- Premium Statistic Commodity import value to Japan from Asia 2018, by region
- Premium Statistic Annual growth rate of electronic components and devices exports value Japan 2010-2018
- Premium Statistic Annual growth rate of audio equipment imports value Japan 2013-2022
Other regions
10
- Premium Statistic Clock & watch import value South Korea 2012-2022
- Premium Statistic Import value of baby food and infant formula into Norway 2013-2021
- Premium Statistic Import value from the Kuwait free trade zone to Kuwait 2010-2019
- Premium Statistic Northern Irish imports out of total for merchandise trade in Ireland 2005-2020
- Premium Statistic Largest exporters of metal outdoor seats to the United States in 2019
- Premium Statistic Largest exporters of wooden framed upholstered chairs to the United States in 2019
- Premium Statistic Import partners of Denmark for enzymes 2016, by import value
- Premium Statistic Value of total imports from the European Union to Turkey 2013 to 2022
- Premium Statistic Dominican Republic: avocado imports value 2014-2020
- Premium Statistic Northern Ireland (UK) exports to non-European Union (EU) markets 2020, by destination
Related statistics
10
- Premium Statistic Export value of electronic component boards Japan 2010-2018
- Premium Statistic Share of businesses planning investments in ERP software in Japan 2011-2016
- Premium Statistic Share of businesses planning investments CRM software in Japan 2011-2016
- Premium Statistic Daiichi Kosho's profit FY 2013-2022
- Premium Statistic Daiichi Kosho's total assets FY 2013-2022
- Premium Statistic Daiichi Kosho's sales FY 2022, by segment
- Premium Statistic Daiichi Kosho's net sales FY 2013-2022
- Premium Statistic Import value of video equipment Japan 2013-2022
- Premium Statistic Annual growth rate of total electronics exports value Japan 2013-2022
- Premium Statistic Number of information and communication electronics manufacturers in Japan 2012-2021
Further related statistics
10
- Iron ore prices 2000-2022
- Secondhand goods: Sales volume percentage change in Great Britain (UK) 2013-2022
- Construction exports worldwide 2020-2021, by country
- Total value of U.S. clothing imports 2011-2022
- Global annual growth in nuclear energy consumption 2022, by country
- Primary energy consumption in China 2012-2022
- Mail order retail: Sales volume percentage change in Great Britain (UK) 2011-2020
- Alcohol and tobacco sales volume percentage increase in Great Britain (UK) 2011-2019
- EBIT of Nestlé Waters worldwide 2007-2019
- Nestlé Waters' sales distribution share worldwide 2010-2019
Further Content: You might find this interesting as well
Statistics
- Iron ore prices 2000-2022
- Secondhand goods: Sales volume percentage change in Great Britain (UK) 2013-2022
- Construction exports worldwide 2020-2021, by country
- Total value of U.S. clothing imports 2011-2022
- Global annual growth in nuclear energy consumption 2022, by country
- Primary energy consumption in China 2012-2022
- Mail order retail: Sales volume percentage change in Great Britain (UK) 2011-2020
- Alcohol and tobacco sales volume percentage increase in Great Britain (UK) 2011-2019
- EBIT of Nestlé Waters worldwide 2007-2019
- Nestlé Waters' sales distribution share worldwide 2010-2019
Statistics Bureau of Japan. (September 1, 2023). Annual growth rate of technology trade import value by business enterprises in Japan from fiscal year 2012 to 2021 [Graph]. In Statista. Retrieved December 09, 2023, from https://www.statista.com/statistics/613974/japan-technology-trade-import-value-growth-rate/
Statistics Bureau of Japan. "Annual growth rate of technology trade import value by business enterprises in Japan from fiscal year 2012 to 2021." Chart. September 1, 2023. Statista. Accessed December 09, 2023. https://www.statista.com/statistics/613974/japan-technology-trade-import-value-growth-rate/
Statistics Bureau of Japan. (2023). Annual growth rate of technology trade import value by business enterprises in Japan from fiscal year 2012 to 2021. Statista. Statista Inc.. Accessed: December 09, 2023. https://www.statista.com/statistics/613974/japan-technology-trade-import-value-growth-rate/
Statistics Bureau of Japan. "Annual Growth Rate of Technology Trade Import Value by Business Enterprises in Japan from Fiscal Year 2012 to 2021." Statista, Statista Inc., 1 Sep 2023, https://www.statista.com/statistics/613974/japan-technology-trade-import-value-growth-rate/
Statistics Bureau of Japan, Annual growth rate of technology trade import value by business enterprises in Japan from fiscal year 2012 to 2021 Statista, https://www.statista.com/statistics/613974/japan-technology-trade-import-value-growth-rate/ (last visited December 09, 2023)
Annual growth rate of technology trade import value by business enterprises in Japan from fiscal year 2012 to 2021 [Graph], Statistics Bureau of Japan, September 1, 2023. [Online]. Available: https://www.statista.com/statistics/613974/japan-technology-trade-import-value-growth-rate/