PSA Peugeot's revenue amounted to around 59 billion euros in 2019.
This statistic presents the volume of car sales by Citroën in Europe between 2011 and 2020. Over the period in consideration, the sales volume declined from approximately 771,000 units in 2011 to around 448,000 units sold in 2020. The parent company of Citroen - Citroën car sales in Europe from 2011 to 2020 (in units)
Basic Account
Get to know the platform
You only have access to basic statistics.
This statistic is not included in your account.
Starter Account
The ideal entry-level account for individual users
- Instant access to 1m statistics
- Download in XLS, PDF & PNG format
- Detailed references
$149 USD / Month *
Professional Account
Full access
Business Solutions including all features.
* Prices do not include sales tax.
Other statistics that may interest you PSA Group
Company figures
8
- Basic Statistic PSA Group's operating income 2019
- Premium Statistic PSA Group's consolidated profit 2017-2019
- Premium Statistic PSA Peugeot R&D expenses 2017-2019
- Premium Statistic PSA Group's revenue 2011-2019
- Basic Statistic PSA Peugeot Citroën's revenue by region 2019
- Premium Statistic PSA Group's revenue by business division 2019
- Basic Statistic Faurecia - global OEM sales 2001-2020
- Basic Statistic Opel/Vauxhall's annual revenue 2017-2018
Product sales
5
- Premium Statistic Vehicles sold by PSA Peugeot Citroën 2011-2020
- Basic Statistic Opel/Vauxhall vehicles sold worldwide 2017, by region
- Premium Statistic Europe: Opel/Vauxhall car sales 2011-2020
- Premium Statistic 
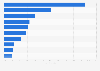
Europe: Citroën car sales from 2011-2020
- Premium Statistic Peugeot car sales in Europe 2011-2021
Competitors
8
- Premium Statistic YTD market share of selected car manufacturers in Europe 2022
- Premium Statistic EU's best-selling car brands: new registrations December 2021-2022
- Premium Statistic Renault Group's revenue 2010-2022
- Premium Statistic Renault Group - net income 2015-2022
- Premium Statistic Regional vehicle sales of Renault Group 2021-2022
- Basic Statistic Volkswagen AG's sales revenue 2006-2022
- Premium Statistic Earnings before tax of Volkswagen AG 2006-2022
- Premium Statistic Volkswagen Group - worldwide vehicle deliveries 2012-2022
Further related statistics
18
- Volkswagen car sales in Austria 2010-2021
- Volkswagen vehicles sold in Australia 2013-2019
- Europe: Seat car sales from 2011-2019
- Volkswagen car sales in Ireland 2009-2019
- Europe: Škoda car sales from 2011-2019
- Volkswagen car sales in Portugal 2008-2019
- Volkswagen car sales in the Czechia 2008-2019
- Volkswagen car sales in Greece 2008-2019
- Volkswagen car registrations in Spain 2009-2019
- Volkswagen car sales in Germany 2008-2022
- Europe: Audi car sales from 2011-2022
- Volkswagen car sales in Turkey 2012-2022
- Volkswagen diesel cars - share of U.S. sales 2007-2015
- VW's car sales in Canada by brand - Q4 2020
- Volkswagen Group: car deliveries by popular model worldwide 2022
- Honduras: motor vehicle unit sales 2019-2020, by type
- Fuel cell vehicle unit sales by country - Americas 2015-2020
- Market shares of best-selling electric battery cars in France 2017
Further Content: You might find this interesting as well
Statistics
- Volkswagen car sales in Austria 2010-2021
- Volkswagen vehicles sold in Australia 2013-2019
- Europe: Seat car sales from 2011-2019
- Volkswagen car sales in Ireland 2009-2019
- Europe: Škoda car sales from 2011-2019
- Volkswagen car sales in Portugal 2008-2019
- Volkswagen car sales in the Czechia 2008-2019
- Volkswagen car sales in Greece 2008-2019
- Volkswagen car registrations in Spain 2009-2019
- Volkswagen car sales in Germany 2008-2022
- Europe: Audi car sales from 2011-2022
- Volkswagen car sales in Turkey 2012-2022
- Volkswagen diesel cars - share of U.S. sales 2007-2015
- VW's car sales in Canada by brand - Q4 2020
- Volkswagen Group: car deliveries by popular model worldwide 2022
- Honduras: motor vehicle unit sales 2019-2020, by type
- Fuel cell vehicle unit sales by country - Americas 2015-2020
- Market shares of best-selling electric battery cars in France 2017
ACEA. (January 16, 2021). Citroën car sales in Europe from 2011 to 2020 (in units) [Graph]. In Statista. Retrieved December 05, 2023, from https://www.statista.com/statistics/642904/eu-citroen-car-sales/
ACEA. "Citroën car sales in Europe from 2011 to 2020 (in units)." Chart. January 16, 2021. Statista. Accessed December 05, 2023. https://www.statista.com/statistics/642904/eu-citroen-car-sales/
ACEA. (2021). Citroën car sales in Europe from 2011 to 2020 (in units). Statista. Statista Inc.. Accessed: December 05, 2023. https://www.statista.com/statistics/642904/eu-citroen-car-sales/
ACEA. "Citroën Car Sales in Europe from 2011 to 2020 (in Units)." Statista, Statista Inc., 16 Jan 2021, https://www.statista.com/statistics/642904/eu-citroen-car-sales/
ACEA, Citroën car sales in Europe from 2011 to 2020 (in units) Statista, https://www.statista.com/statistics/642904/eu-citroen-car-sales/ (last visited December 05, 2023)
Citroën car sales in Europe from 2011 to 2020 (in units) [Graph], ACEA, January 16, 2021. [Online]. Available: https://www.statista.com/statistics/642904/eu-citroen-car-sales/