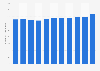
In 2022, the number of security personnel in Japan stood at approximately 1.24 million employees. In that year, about 87.1 percent of those workers were male. Over the course of the observed period, employee numbers in this sector had been increasing gradually until they peaked in 2019 and 2020 at around 1.33 million employees.
Number of security employees in Japan from 2013 to 2022 (in millions)
Basic Account
Get to know the platform
You only have access to basic statistics.
This statistic is not included in your account.
Starter Account
The ideal entry-level account for individual users
- Instant access to 1m statistics
- Download in XLS, PDF & PNG format
- Detailed references
$199 USD / Month *
Professional Account
Full access
Business Solutions including all features.
* Prices do not include sales tax.
Other statistics that may interest you Statistics on
About the industry
10
- Premium Statistic Annual change in average monthly salary Japan 2018-2023
- Premium Statistic Number of clerical employees in Japan 2013-2022
- Premium Statistic Number of sales employees in Japan 2013-2022
- Premium Statistic Number of agricultural, forestry and fishery employees in Japan 2013-2022
- Premium Statistic Number of construction and mining employees in Japan 2013-2022
- Premium Statistic Average monthly contractual wages Japan 2014-2023
- Premium Statistic Number of carrying, cleaning and packaging employees in Japan 2013-2022
- Premium Statistic Average monthly scheduled wages Japan 2014-2023
- Basic Statistic Share of permanent full-time and part-time employees in Finland 2013-2023
- Basic Statistic Employment rate in Finland 2013-2023, by gender
About the region
10
- Premium Statistic Number of intra-prefectural migrants in Japan in 2022, by prefecture
- Premium Statistic Number of domestic immigrants to prefectures within Japan in 2022, by prefecture
- Premium Statistic Number of domestic emigrants to other prefectures within Japan in 2022, by prefecture
- Premium Statistic Net migration and loss Japan in 2022, by prefecture
- Premium Statistic Daytime population of Japan 2020, by prefecture
- Premium Statistic Security services LPI in Japan 2013-2022
- Premium Statistic Average monthly non-scheduled wages Japan 2014-2023
- Premium Statistic Average monthly bonus wages Japan 2014-2023
- Premium Statistic Average number of monthly working days Japan 2014-2023
- Premium Statistic Average number of scheduled monthly working hours Japan 2014-2023
Selected statistics
2
Other regions
10
- Premium Statistic Industries employing the largest number of security guards in the U.S. 2022
- Premium Statistic Brazil: private security services gross revenue 2018-2019
- Premium Statistic Revenue of Securitas AB worldwide from 2011 to 2022
- Premium Statistic Number of employees Egypt 2016, by sector
- Premium Statistic Colombia: revenue of investigation & security services 2014-2019
- Premium Statistic Revenue by region of ADT Inc. worldwide 2016-2019
- Premium Statistic Employees in the security sector in the Netherlands 2020, by branch
- Basic Statistic Employment in the informal sector in Angola 2021, by age
- Premium Statistic Mexico: direct and indirect spending in private security 2021
- Premium Statistic Share of employment in Libya 2010-2019, by sector
Related statistics
10
- Premium Statistic Average number of monthly overtime hours Japan 2014-2023
- Premium Statistic Female unemployment rate Japan 2013-2022
- Premium Statistic Share of men among employed people Japan 2022, by occupation
- Premium Statistic Average number of monthly working hours Japan 2014-2023
- Premium Statistic Science and research institutions LPI Japan 2011-2020
- Premium Statistic Prefectures with high job prospects in Japan 2019
- Premium Statistic Japan's PCSI Sub-Index Employment Confidence 2018-2019
- Premium Statistic Average annual wage Japan 2000-2021
- Premium Statistic Technical intern training residents applying for refugee status Japan 2013-2022
- Premium Statistic Net ODA disbursements in Japan 2021, by type
Further related statistics
2
Further Content: You might find this interesting as well
Statistics Bureau of Japan. (September 29, 2023). Number of security employees in Japan from 2013 to 2022 (in millions) [Graph]. In Statista. Retrieved April 19, 2024, from https://www.statista.com/statistics/644143/japan-employment-security-workers/
Statistics Bureau of Japan. "Number of security employees in Japan from 2013 to 2022 (in millions)." Chart. September 29, 2023. Statista. Accessed April 19, 2024. https://www.statista.com/statistics/644143/japan-employment-security-workers/
Statistics Bureau of Japan. (2023). Number of security employees in Japan from 2013 to 2022 (in millions). Statista. Statista Inc.. Accessed: April 19, 2024. https://www.statista.com/statistics/644143/japan-employment-security-workers/
Statistics Bureau of Japan. "Number of Security Employees in Japan from 2013 to 2022 (in Millions)." Statista, Statista Inc., 29 Sep 2023, https://www.statista.com/statistics/644143/japan-employment-security-workers/
Statistics Bureau of Japan, Number of security employees in Japan from 2013 to 2022 (in millions) Statista, https://www.statista.com/statistics/644143/japan-employment-security-workers/ (last visited April 19, 2024)
Number of security employees in Japan from 2013 to 2022 (in millions) [Graph], Statistics Bureau of Japan, September 29, 2023. [Online]. Available: https://www.statista.com/statistics/644143/japan-employment-security-workers/