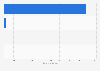
The statistic shows the average number of employees of foreign-controlled and nationally controlled enterprises in the industrial sector in Italy in 2017. As of the survey period, foreign-controlled enterprises in manufacturing activities employed on average about 136 individuals, a sharp contrast compared to only 8.5 individuals employed by nationally controlled enterprises in the same sector.
Average number of employees of foreign-controlled and nationally controlled enterprises in the industrial sector in Italy in 2017
Basic Account
Get to know the platform
You only have access to basic statistics.
This statistic is not included in your account.
Starter Account
The ideal entry-level account for individual users
- Instant access to 1m statistics
- Download in XLS, PDF & PNG format
- Detailed references
$199 USD / Month *
Professional Account
Full access
Business Solutions including all features.
* Prices do not include sales tax.
Other statistics that may interest you Statistics on
About the industry
10
- Premium Statistic Labor costs per employee in Italian foreign-/nationally controlled industries 2017
- Premium Statistic Italian foreign affiliates in the manufacturing sector 2018
- Premium Statistic Value added by Italian foreign affiliates in manufacturing 2018
- Premium Statistic R&D spending of Italian resident foreign affiliates in the services sector 2018
- Premium Statistic R&D spending of Italian resident foreign affiliates in the manufacturing sector 2018
- Premium Statistic Number of Norwegian-controlled wholesale & retail trade enterprises abroad 2009-2019
- Premium Statistic Turnover of Norwegian-controlled enterprises abroad 2019, by continent
- Premium Statistic Income terms of trade index of foreign trade in India FY 2014-2022
- Basic Statistic Y-o-Y industrial production growth rate in Italy 2020/2021, by industrial groupings
- Premium Statistic GDP for manufacturing in Kuwait 2014-2019
About the region
10
- Premium Statistic R&D spending per employee in foreign-/nationally controlled enterprises in Italy 2017
- Premium Statistic Investment per employee in foreign-/nationally controlled industries in Italy 2017
- Premium Statistic R&D spending of resident foreign affiliates in Italy 2018
- Premium Statistic Top foreign countries controlling industrial activities in Italy 2018
- Premium Statistic Number of resident foreign affiliates in Italy 2018, by sector
- Premium Statistic Exports of goods/services of foreign affiliates in the industry sector in Italy 2017
- Premium Statistic Year-on-year percent change in labor costs per employee in Italy 2018, by sector
- Basic Statistic Italy: electricity, gas & air conditioning sector employees 2012-2021
- Basic Statistic Italy: employees in the beer manufacturing industry 2012-2021
- Premium Statistic Number of domestic customers switching electricity and gas suppliers Italy 2019-2021
Other regions
10
- Premium Statistic Number of people employed in the production sector UK 2021, by enterprise size
- Premium Statistic Anhui Conch Cement's number of employees by segment 2022
- Premium Statistic Industrial production value in Russia 2016-2021, by sector
- Premium Statistic Largest energy companies in Denmark 2022, by employees
- Premium Statistic Largest energy companies in Sweden 2022, by employees
- Premium Statistic Utilities companies in France ranking based on number of employees 2024
- Basic Statistic U.S. monthly change in nonfarm payroll employment 2024, by industry
- Premium Statistic Real GVA in manufacturing, construction and utilities sector in India FY 2012-2023
- Basic Statistic Hungary: employees in the beer manufacturing industry 2012-2021
- Basic Statistic Bosnia-Herzegovina: electricity, gas & air conditioning sector employees 2013-2021
Related statistics
10
- Basic Statistic Employment rate monthly in Italy 2019-2021
- Basic Statistic Employment in Italy 2020, by economic sector
- Basic Statistic Quarterly employment rate in Italy 2023, by region
- Basic Statistic Employment by economic sector in Italy 2019-2020
- Basic Statistic Employment rate quarterly in Italy 2019-2023
- Basic Statistic Economic activity rate 15-64 years old in Italy 2019-2020
- Basic Statistic Productivity index in the manufacturing sector in Italy 2002-2019
- Premium Statistic Added value per employee of foreign/nationally controlled manufacturers in Italy 2017
- Premium Statistic Italy: ROI of manufacturing industry 2017-2023
- Premium Statistic Italy: leading industrial and service companies 2017, by number of employees
Further related statistics
10
- Number of employees at HSBC 2010-2023
- Number of employees of Vinci worldwide 1991-2023
- Number of CBRE Group employees 2009-2022
- John Lewis Partnership: number of employees in the United Kingdom (UK) 2009-2023
- Number of employees at China Telecom 2012-2022
- Number of employees of the adidas Group worldwide from 2000 to 2023
- Air Liquide's number of employees 2005-2023
- Number of employees of the InterContinental Hotel Group 2023
- Number of Rio Tinto's employees 2010-2023
- Main employment centers of HSBC in 2023, by number of employees
Further Content: You might find this interesting as well
Statistics
- Number of employees at HSBC 2010-2023
- Number of employees of Vinci worldwide 1991-2023
- Number of CBRE Group employees 2009-2022
- John Lewis Partnership: number of employees in the United Kingdom (UK) 2009-2023
- Number of employees at China Telecom 2012-2022
- Number of employees of the adidas Group worldwide from 2000 to 2023
- Air Liquide's number of employees 2005-2023
- Number of employees of the InterContinental Hotel Group 2023
- Number of Rio Tinto's employees 2010-2023
- Main employment centers of HSBC in 2023, by number of employees
Topics
Electricity in SpainIstat. (November 22, 2019). Average number of employees of foreign-controlled and nationally controlled enterprises in the industrial sector in Italy in 2017 [Graph]. In Statista. Retrieved April 18, 2024, from https://www.statista.com/statistics/645087/average-number-of-employees-of-foreign-controlled-and-nationally-controlled-enterprises-in-the-industrial-sector-in-italy/
Istat. "Average number of employees of foreign-controlled and nationally controlled enterprises in the industrial sector in Italy in 2017." Chart. November 22, 2019. Statista. Accessed April 18, 2024. https://www.statista.com/statistics/645087/average-number-of-employees-of-foreign-controlled-and-nationally-controlled-enterprises-in-the-industrial-sector-in-italy/
Istat. (2019). Average number of employees of foreign-controlled and nationally controlled enterprises in the industrial sector in Italy in 2017. Statista. Statista Inc.. Accessed: April 18, 2024. https://www.statista.com/statistics/645087/average-number-of-employees-of-foreign-controlled-and-nationally-controlled-enterprises-in-the-industrial-sector-in-italy/
Istat. "Average Number of Employees of Foreign-controlled and Nationally Controlled Enterprises in The Industrial Sector in Italy in 2017." Statista, Statista Inc., 22 Nov 2019, https://www.statista.com/statistics/645087/average-number-of-employees-of-foreign-controlled-and-nationally-controlled-enterprises-in-the-industrial-sector-in-italy/
Istat, Average number of employees of foreign-controlled and nationally controlled enterprises in the industrial sector in Italy in 2017 Statista, https://www.statista.com/statistics/645087/average-number-of-employees-of-foreign-controlled-and-nationally-controlled-enterprises-in-the-industrial-sector-in-italy/ (last visited April 18, 2024)
Average number of employees of foreign-controlled and nationally controlled enterprises in the industrial sector in Italy in 2017 [Graph], Istat, November 22, 2019. [Online]. Available: https://www.statista.com/statistics/645087/average-number-of-employees-of-foreign-controlled-and-nationally-controlled-enterprises-in-the-industrial-sector-in-italy/