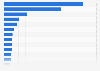


Hours online on an average day at home New Zealand 2011-2015
This statistic depicts the number of hours spent online by internet users while at home on an average day in New Zealand from 2011 to 2015. In 2015, 46 percent of respondents indicated that at home on an average day they would spend three hours or more online.


