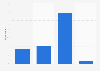
This statistic shows the share of overdue invoices in the total sales to B2B customers in Belgium from 2013 to 2017. In 2017, approximately 45 percent of the sales to domestic B2B customers turned into overdue invoices.
Share of overdue invoices in the total sales to B2B customers in Belgium from 2013 to 2017
Basic Account
Get to know the platform
You only have access to basic statistics.
This statistic is not included in your account.
Starter Account
The ideal entry-level account for individual users
- Instant access to 1m statistics
- Download in XLS, PDF & PNG format
- Detailed references
$189 USD $149 USD / Month *
in the first 12 months
Professional Account
Full access
Business Solutions including all features.
* Prices do not include sales tax.
Other statistics that may interest you Statistics on
About the industry
10
- Basic Statistic Use of trade credit for SMEs in the Netherlands 2019
- Premium Statistic Factoring volume in the Netherlands 2007-2021
- Premium Statistic Outstanding business loans from SMEs in Luxembourg 2007-2020
- Premium Statistic PE/VC start-up financing in India by sector 2021
- Premium Statistic Change of value added and employment of SMEs in Italy 2019-2020
- Basic Statistic Use of trade credit for SMEs in Belgium 2020
- Basic Statistic SME respondents who applied for trade credit financing in Belgium 2020
- Basic Statistic SME respondents who applied for trade credit financing in the Netherlands 2020
- Premium Statistic Factoring volume in Belgium 2007-2019
- Premium Statistic Factoring volume in Luxembourg 2007-2019
About the region
10
- Basic Statistic Use of leasing or hire-purchase for SMEs in Belgium 2020
- Premium Statistic Bank loan distribution to companies in Belgium 2005-2020, by company size
- Premium Statistic Credit loan share in total liabilities of companies in Belgium 2013-2019
- Premium Statistic Outstanding SME business loans in Belgium 2007-2018
- Premium Statistic Belgium: persons employed in the non-financial economy by employment size class 2014
- Premium Statistic ATMs per capita in Belgium 2005-2020
- Premium Statistic Total equity of BNP Paribas Fortis 2014-2022
- Premium Statistic Total assets of BNP Paribas Fortis 2014-2022
- Premium Statistic Number of bank employees in Belgium 2021, by type of bank
- Premium Statistic Number of bank branches in Belgium 2021, by region
Other regions
10
- Premium Statistic Share of B2B sales on credit in Central and Eastern Europe 2018
- Premium Statistic Employees in financial insurance services industry New Zealand 2019 by employee count
- Premium Statistic Contribution of SMEs to the increase in GDP in Italy 2009-2017, by company size
- Premium Statistic Server OS usage by enterprises in the Netherlands 2017
- Premium Statistic (Bi)annual net revenue of Adyen 2015-2023, in domestic currency and USD
- Premium Statistic Survey on strengthening of Germany as a financial center because of Brexit 2019
- Premium Statistic Total outstanding in business loans in Latvia 2007-2018
- Premium Statistic Total outstanding in business loans in Greece 2007-2018
- Premium Statistic Total outstanding in business loans in Portugal 2007-2018
- Premium Statistic Brazil: net revenue of PagSeguro 2015-2019
Related statistics
10
- Premium Statistic Net value of finance raised by businesses in the United Kingdom 2013-2022
- Premium Statistic Use of bank loans for SMEs in Luxembourg 2021
- Basic Statistic Use of leasing or hire-purchase for SMEs in the Netherlands 2020
- Basic Statistic Use of leasing or hire-purchase for SMEs in Luxembourg 2020
- Premium Statistic Annual change in lending to business in the United Kingdom 2013-2020
- Premium Statistic Total outstanding in business loans in Slovakia 2007-2018
- Premium Statistic Total outstanding in business loans in Sweden 2012-2017
- Premium Statistic Total outstanding in business loans in Czechia 2008-2018
- Premium Statistic Total outstanding in business loans in Switzerland 2007-2017=8
- Premium Statistic Total outstanding in business loans in Finland 2007-2018
Further related statistics
10
- Senior chief financial officer salary per annum in Switzerland 2023
- Total assets of the Industrial and Commercial Bank of China 2012-2022
- Operating income of the Industrial and Commercial Bank of China 2012-2022
- Total assets of the Bank of Communications 2012-2022
- Revenue of the Bank of Communications 2022
- Total assets of the China Construction Bank 2012-2022
- Ping An Insurance's annual revenue 2012-2022
- Total assets of China Pacific Insurance 2012-2022
- Total assets of Banco Santander 2001-2022
- Profit development of Santander group 2001-2022
Further Content: You might find this interesting as well
Statistics
- Senior chief financial officer salary per annum in Switzerland 2023
- Total assets of the Industrial and Commercial Bank of China 2012-2022
- Operating income of the Industrial and Commercial Bank of China 2012-2022
- Total assets of the Bank of Communications 2012-2022
- Revenue of the Bank of Communications 2022
- Total assets of the China Construction Bank 2012-2022
- Ping An Insurance's annual revenue 2012-2022
- Total assets of China Pacific Insurance 2012-2022
- Total assets of Banco Santander 2001-2022
- Profit development of Santander group 2001-2022
Atradius. (April 11, 2017). Share of overdue invoices in the total sales to B2B customers in Belgium from 2013 to 2017 [Graph]. In Statista. Retrieved September 29, 2023, from https://www.statista.com/statistics/698151/share-of-overdue-b2b-invoices-in-belgium/
Atradius. "Share of overdue invoices in the total sales to B2B customers in Belgium from 2013 to 2017." Chart. April 11, 2017. Statista. Accessed September 29, 2023. https://www.statista.com/statistics/698151/share-of-overdue-b2b-invoices-in-belgium/
Atradius. (2017). Share of overdue invoices in the total sales to B2B customers in Belgium from 2013 to 2017. Statista. Statista Inc.. Accessed: September 29, 2023. https://www.statista.com/statistics/698151/share-of-overdue-b2b-invoices-in-belgium/
Atradius. "Share of Overdue Invoices in The Total Sales to B2b Customers in Belgium from 2013 to 2017." Statista, Statista Inc., 11 Apr 2017, https://www.statista.com/statistics/698151/share-of-overdue-b2b-invoices-in-belgium/
Atradius, Share of overdue invoices in the total sales to B2B customers in Belgium from 2013 to 2017 Statista, https://www.statista.com/statistics/698151/share-of-overdue-b2b-invoices-in-belgium/ (last visited September 29, 2023)
Share of overdue invoices in the total sales to B2B customers in Belgium from 2013 to 2017 [Graph], Atradius, April 11, 2017. [Online]. Available: https://www.statista.com/statistics/698151/share-of-overdue-b2b-invoices-in-belgium/