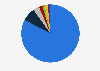
This statistic shows the results of a survey on the average number of products with Fairtrade label bough per month in Sweden in 2018. During the survey period, 29 percent of the respondents stated to buy on average five or more Fairtrade labeled products every month. Around four products were bought by 11 percent of the respondents. 12 percent of the respondents stated to never buy any products with Fairtrade label.
On average how many products with Fairtrade label do you buy per month?
Basic Account
Get to know the platform
You only have access to basic statistics.
This statistic is not included in your account.
Starter Account
The ideal entry-level account for individual users
- Instant access to 1m statistics
- Download in XLS, PDF & PNG format
- Detailed references
$199 USD / Month *
Professional Account
Full access
Business Solutions including all features.
* Prices do not include sales tax.
Other statistics that may interest you Statistics on
About the industry
10
- Premium Statistic Product categories which Millennials are loyal to globally 2019
- Premium Statistic What keeps consumers loyal to brands globally 2022
- Premium Statistic St. Patrick's Day spending by U.S. consumers 2007-2024
- Premium Statistic U.S. households' average planned St. Patrick's Day spending 2007-2024
- Premium Statistic St. Patrick's Day purchasing plans of U.S. consumers 2024
- Premium Statistic Easter spending by U.S. consumers 2009-2024
- Premium Statistic Planned Easter spending by consumers in the United States in 2024, by category
- Premium Statistic Trust in branded products among singles and the general population in Germany 2021
- Premium Statistic Consumer preference for brands with their values in selected markets worldwide 2023
- Premium Statistic Share of consumers open to buying resale items worldwide as of 2021, by age
About the region
10
- Premium Statistic Private label share in Willys stores in Sweden 2014-2021
- Basic Statistic Consumer activism in Sweden 2013
- Premium Statistic Market share of selected dietary supplement brands in Sweden 2022
- Premium Statistic Market share of selected vitamin brands in Sweden 2022
- Premium Statistic Market share of selected sport nutrition brands in Sweden 2022
- Premium Statistic Survey on importance of ethical standards of food in Sweden 2019
- Basic Statistic Black Friday shopping plans in Sweden 2018
- Premium Statistic Share of eco-labeled home textiles among all home textiles bought in Sweden 2018
- Premium Statistic Attitudes towards online shopping in Sweden 2023
- Premium Statistic Attitudes towards traveling in Sweden 2023
Selected statistics
3
Other regions
10
- Basic Statistic Leading Chinese brands 2023, by BSI
- Premium Statistic Most meaningful types of brand-produced content in Poland 2020
- Basic Statistic Brand value in China 2022, by sector
- Basic Statistic Consumer activism in Germany 2013
- Premium Statistic Ranking of key criteria for consumers when buying products in France 2018
- Premium Statistic Cheddar cheese sales volume in Great Britain 2012-2017, by private label/brand
- Premium Statistic Latin America: preferred food label ingredients 2019
- Basic Statistic Consumer activism in Italy 2013
- Premium Statistic Leading cider brands in the Faroe Islands 2019, by sales volume
- Premium Statistic Black Friday: share of consumers who intend to buy goods in the UK 2016-2020, by age
Related statistics
10
- Premium Statistic Drivers of customer loyalty in the Great Britain 2017
- Premium Statistic Trend in buying Fair Trade products in Great Britain 2003-2015
- Premium Statistic Total expected spending on graduation gifts U.S. 2007-2023
- Premium Statistic U.S. Father's Day expenditure by category 2023
- Premium Statistic U.S. Mother's Day flower expenditure 2007-2023
- Premium Statistic Mother's Day expenditure per person in the U.S. 2009-2023
- Premium Statistic Average planned U.S. Mother's Day expenditure by category 2013-2023
- Premium Statistic Graduation gifts: U.S. consumers' planned spend 2022, by region
- Premium Statistic Graduation gifts: U.S. consumers' planned spend 2022, by age
- Premium Statistic Average spending on Christmas gifts in the U.S. 2000-2023
Further related statistics
10
- Hugo Boss - EBITDA 2005-2023
- Number of Hugo Boss stores worldwide in 2023, by region
- Market share of the Coke Classic brand in the U.S. 2008-2022
- Market share of the Diet Coke brand in the U.S. 2008-2022
- Market share of the Dr Pepper brand in the U.S. 2008-2022
- Market share of the Sprite brand in the U.S. 2008-2022
- Market share of the Diet Dr Pepper brand in the U.S. 2008-2022
- Number of Hugo Boss stores worldwide in 2020, by store type
- Fair Trade certified vanilla, herbs and spices: U.S. imports 2007-2012
- Japan: IT spending 2005-2014
Further Content: You might find this interesting as well
Statistics
- Hugo Boss - EBITDA 2005-2023
- Number of Hugo Boss stores worldwide in 2023, by region
- Market share of the Coke Classic brand in the U.S. 2008-2022
- Market share of the Diet Coke brand in the U.S. 2008-2022
- Market share of the Dr Pepper brand in the U.S. 2008-2022
- Market share of the Sprite brand in the U.S. 2008-2022
- Market share of the Diet Dr Pepper brand in the U.S. 2008-2022
- Number of Hugo Boss stores worldwide in 2020, by store type
- Fair Trade certified vanilla, herbs and spices: U.S. imports 2007-2012
- Japan: IT spending 2005-2014
Fairtrade Sverige. (February 14, 2018). On average how many products with Fairtrade label do you buy per month? [Graph]. In Statista. Retrieved April 23, 2024, from https://www.statista.com/statistics/706690/survey-on-average-monthly-number-of-fairtrade-products-bought-in-sweden/
Fairtrade Sverige. "On average how many products with Fairtrade label do you buy per month?." Chart. February 14, 2018. Statista. Accessed April 23, 2024. https://www.statista.com/statistics/706690/survey-on-average-monthly-number-of-fairtrade-products-bought-in-sweden/
Fairtrade Sverige. (2018). On average how many products with Fairtrade label do you buy per month?. Statista. Statista Inc.. Accessed: April 23, 2024. https://www.statista.com/statistics/706690/survey-on-average-monthly-number-of-fairtrade-products-bought-in-sweden/
Fairtrade Sverige. "On Average How Many Products with Fairtrade Label Do You Buy per Month?." Statista, Statista Inc., 14 Feb 2018, https://www.statista.com/statistics/706690/survey-on-average-monthly-number-of-fairtrade-products-bought-in-sweden/
Fairtrade Sverige, On average how many products with Fairtrade label do you buy per month? Statista, https://www.statista.com/statistics/706690/survey-on-average-monthly-number-of-fairtrade-products-bought-in-sweden/ (last visited April 23, 2024)
On average how many products with Fairtrade label do you buy per month? [Graph], Fairtrade Sverige, February 14, 2018. [Online]. Available: https://www.statista.com/statistics/706690/survey-on-average-monthly-number-of-fairtrade-products-bought-in-sweden/