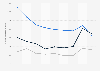
Average annual expenditure on butter per household in Canada from 2013 to 2021 (in Canadian dollars)
Basic Account
Get to know the platform
You only have access to basic statistics.
This statistic is not included in your account.
Starter Account
The ideal entry-level account for individual users
- Instant access to 1m statistics
- Download in XLS, PDF & PNG format
- Detailed references
$199 USD / Month *
Professional Account
Full access
Business Solutions including all features.
* Prices do not include sales tax.
Other statistics that may interest you Statistics on
About the industry
10
- Premium Statistic Annual expenditure on cheese per Canadian household 2015-2021
- Premium Statistic Annual expenditure on ice cream and ice milk per Canadian household 2011-2017
- Premium Statistic Annual expenditure on cheese per Canadian household by type 2017
- Premium Statistic Average household expenditure on ice cream in Denmark 2010-2022
- Basic Statistic U.S. per capita consumption of dairy products 2022, by type
- Premium Statistic Per capita consumption of dairy products in Canada by category 2018
- Basic Statistic U.S. per capita consumption of low fat cottage cheese 2000-2021
- Basic Statistic U.S. per capita consumption of Italian cheese 2000-2022
- Premium Statistic Per capita consumption of frozen dairy products in the U.S. 2000-2022
- Basic Statistic U.S. per capita consumption of low-fat ice cream 2000 to 2022
About the region
10
- Premium Statistic Annual expenditure on pasta per Canadian household 2011-2021
- Premium Statistic Annual expenditure on non-alcoholic beverages per Canadian household 2013-2021
- Premium Statistic Annual expenditure on frozen food per Canadian household 2013-2021
- Premium Statistic Annual expenditure on snack foods per Canadian household 2011-2021
- Premium Statistic Consumption of processed cheese per capita in Canada 2010-2018
- Premium Statistic Consumption of yogurt per capita in Canada 2004-2018
- Basic Statistic Consumption of ice cream per capita in Canada 2004-2016
- Premium Statistic Consumption of milk per capita in Canada 2015-2022
- Premium Statistic Consumption of cheese per capita in Canada 2005-2024
- Premium Statistic Consumption of butter per capita in Canada 2004-2024
Selected statistics
2
Other regions
10
- Premium Statistic Sources of protein consumed by Americans 2017
- Premium Statistic Average household expenditure on fresh low-fat milk in Denmark 2012-2022
- Premium Statistic Per capita consumption of whole milk in Finland 2012-2022
- Premium Statistic Household consumption expenditure on bread and cereals in Sweden 2009-2021
- Premium Statistic Per capita consumption of cheese in Luxembourg 2010-2021
- Premium Statistic Share of PFCE on food and beverages in India FY 2012-2018
- Basic Statistic Daily share of milk and milk alternative intake per capita Australia FY 2021
- Premium Statistic Milk, cheese, and eggs purchase trend in Italy 2021
- Premium Statistic Per capita consumption of yoghurt in Belgium 2000-2021
- Basic Statistic Household consumption expenditure on food and beverages in Iceland 2011-2022
Related statistics
8
- Basic Statistic U.S. per capita consumption of frozen yogurt 2000-2022
- Basic Statistic U.S. per capita consumption of American cheese 2000-2022
- Basic Statistic U.S. per capita consumption of Swiss cheese 2000-2022
- Basic Statistic U.S. per capita consumption of cream cheese 2000-2022
- Premium Statistic Percentage of at-home and away-from-home milk consumption in the U.S. 2011
- Premium Statistic Global per capita consumption of fluid milk 2022, by country
- Premium Statistic Global per capita consumption of butter 2022, by country
- Premium Statistic Global per capita consumption of cheese 2022, by country
Further related statistics
10
- Household food and drink waste cost distribution in the UK 2012, by food group
- Coal consumption in South Africa 1998-2022
- Mondelez International's net revenue distribution worldwide by sector 2022
- Mondelez International's operating income worldwide 2011-2022
- Mondelez International's global workforce by region 2012-2022
- Flowers Foods: sales in the U.S. 2010-2022
- Flowers Foods: net income in the U.S. 2010-2022
- Flowers Foods: U.S. sales 2021-2022, by retail segment
- Flowers Foods: sales share in the U.S. 2021 & 2022, by segment
- Import volume of cobalt in the U.S. 2010-2023
Further Content: You might find this interesting as well
Statistics
- Household food and drink waste cost distribution in the UK 2012, by food group
- Coal consumption in South Africa 1998-2022
- Mondelez International's net revenue distribution worldwide by sector 2022
- Mondelez International's operating income worldwide 2011-2022
- Mondelez International's global workforce by region 2012-2022
- Flowers Foods: sales in the U.S. 2010-2022
- Flowers Foods: net income in the U.S. 2010-2022
- Flowers Foods: U.S. sales 2021-2022, by retail segment
- Flowers Foods: sales share in the U.S. 2021 & 2022, by segment
- Import volume of cobalt in the U.S. 2010-2023
StatCan. (October 18, 2023). Average annual expenditure on butter per household in Canada from 2013 to 2021 (in Canadian dollars) [Graph]. In Statista. Retrieved April 23, 2024, from https://www.statista.com/statistics/724530/annual-expenditure-on-butter-per-canadian-household/
StatCan. "Average annual expenditure on butter per household in Canada from 2013 to 2021 (in Canadian dollars)." Chart. October 18, 2023. Statista. Accessed April 23, 2024. https://www.statista.com/statistics/724530/annual-expenditure-on-butter-per-canadian-household/
StatCan. (2023). Average annual expenditure on butter per household in Canada from 2013 to 2021 (in Canadian dollars). Statista. Statista Inc.. Accessed: April 23, 2024. https://www.statista.com/statistics/724530/annual-expenditure-on-butter-per-canadian-household/
StatCan. "Average Annual Expenditure on Butter per Household in Canada from 2013 to 2021 (in Canadian Dollars)." Statista, Statista Inc., 18 Oct 2023, https://www.statista.com/statistics/724530/annual-expenditure-on-butter-per-canadian-household/
StatCan, Average annual expenditure on butter per household in Canada from 2013 to 2021 (in Canadian dollars) Statista, https://www.statista.com/statistics/724530/annual-expenditure-on-butter-per-canadian-household/ (last visited April 23, 2024)
Average annual expenditure on butter per household in Canada from 2013 to 2021 (in Canadian dollars) [Graph], StatCan, October 18, 2023. [Online]. Available: https://www.statista.com/statistics/724530/annual-expenditure-on-butter-per-canadian-household/