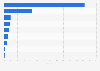
This statistic shows the results of a survey on the use of discount offers received in the mailbox in Sweden in 2018. During the survey period, 29 percent of Swedish respondents stated that they use discount vouchers received in their mailbox sometimes per month or more often.
Share of people using discount offers sometimes per month or more often in Sweden in 2018
Basic Account
Get to know the platform
You only have access to basic statistics.
This statistic is not included in your account.
Starter Account
The ideal entry-level account for individual users
- Instant access to 1m statistics
- Download in XLS, PDF & PNG format
- Detailed references
$199 USD / Month *
Professional Account
Full access
Business Solutions including all features.
* Prices do not include sales tax.
Other statistics that may interest you Statistics on
About the industry
9
- Premium Statistic Preferred channel for advertising from stores/companies in Sweden 2018
- Premium Statistic Best advertising channels to reach individuals in Sweden 2018
- Basic Statistic Opinions about advertising during the coronavirus pandemic in Norway 2020
- Premium Statistic Attitudes to press advertising in Poland 2020
- Premium Statistic Attitudes to press information in Poland 2020
- Premium Statistic Italy: Millennials' opinion on the influence of advertising 2016, by source
- Premium Statistic Honesty of advertising in the U.S. 2014-2017
- Premium Statistic Attitudes towards advertising in Sweden 2022
- Basic Statistic Image perception of women in ads by female respondents in Russia 2021, by type
About the region
10
- Basic Statistic Share of individuals taking note of TV advertising in Sweden 2008-2018, by gender
- Basic Statistic Share of individuals taking note of morning paper advertising in Sweden 2008-2018
- Basic Statistic Individuals taking note of morning paper advertising in Sweden 2008-2018, by age
- Basic Statistic Share of individuals taking note of evening paper advertising in Sweden 2008-2018
- Basic Statistic Individuals taking note of evening paper advertising in Sweden 2008-2018, by gender
- Basic Statistic Impact of the coronavirus on newspaper advertising revenue in Sweden 2020
- Basic Statistic Share of individuals taking note of TV advertising in Sweden 2008-2018
- Premium Statistic Perception of advertising on social media in Sweden in 2017, by platform
- Premium Statistic Media advertising spending in Sweden 2014-2022
- Premium Statistic Direct advertising spending in Sweden 2009-2022
Other regions
10
- Basic Statistic B&M group: number of stores in the United Kingdom (UK) & Germany 2019, by brand
- Premium Statistic Relevance of sponsored advertising in social media in Norway 2018, by generation
- Basic Statistic United States: number of dollar stores 2017-2022
- Premium Statistic Viewers' favorite Vietnamese football players to appear in TVCFs in Vietnam 2019
- Premium Statistic Viewer irritation concerning video adverts in Poland in 2019, by medium
- Premium Statistic Influence of cosmetics online advertising in South Korea in 2018
- Premium Statistic Promotional product popularity in Paris (France) 2016, by type
- Premium Statistic Discount channel's value share of the grocery market in Europe 2017
- Basic Statistic Peru: leading streets in Lima 2017, by OOH ads
- Premium Statistic Consumer buy-in Ramadhan edition instant noodle advertisements Indonesia 2019
Related statistics
10
- Basic Statistic Advertising market development due to COVID-19 in Norway 2020
- Basic Statistic Advertising spending in Iceland 2009-2022
- Basic Statistic Outdoor advertising revenue in Iceland 2008-2022
- Premium Statistic Distribution of advertising revenue in Iceland 2022, by medium
- Basic Statistic Advertising revenue in Norway 2008-2021
- Basic Statistic Online media advertising revenue in Iceland 1998-2022
- Premium Statistic Media advertising spending in Norway 2013-2022
- Premium Statistic Magazine advertising revenue in Denmark 2009-2020
- Premium Statistic Share of Danish advertising revenue abroad 2009-2020
- Premium Statistic TV advertising revenue in Denmark 2009-2020
Further related statistics
1
Further Content: You might find this interesting as well
PostNord. (May 3, 2018). Share of people using discount offers sometimes per month or more often in Sweden in 2018 [Graph]. In Statista. Retrieved April 24, 2024, from https://www.statista.com/statistics/725263/survey-on-the-usage-of-discount-offers-in-sweden-by-frequency/
PostNord. "Share of people using discount offers sometimes per month or more often in Sweden in 2018." Chart. May 3, 2018. Statista. Accessed April 24, 2024. https://www.statista.com/statistics/725263/survey-on-the-usage-of-discount-offers-in-sweden-by-frequency/
PostNord. (2018). Share of people using discount offers sometimes per month or more often in Sweden in 2018. Statista. Statista Inc.. Accessed: April 24, 2024. https://www.statista.com/statistics/725263/survey-on-the-usage-of-discount-offers-in-sweden-by-frequency/
PostNord. "Share of People Using Discount Offers Sometimes per Month or More Often in Sweden in 2018." Statista, Statista Inc., 3 May 2018, https://www.statista.com/statistics/725263/survey-on-the-usage-of-discount-offers-in-sweden-by-frequency/
PostNord, Share of people using discount offers sometimes per month or more often in Sweden in 2018 Statista, https://www.statista.com/statistics/725263/survey-on-the-usage-of-discount-offers-in-sweden-by-frequency/ (last visited April 24, 2024)
Share of people using discount offers sometimes per month or more often in Sweden in 2018 [Graph], PostNord, May 3, 2018. [Online]. Available: https://www.statista.com/statistics/725263/survey-on-the-usage-of-discount-offers-in-sweden-by-frequency/