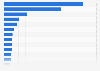
The statistic depicts the percentage of internet users who have paid for sports-related media in Japan as of September 2016, broken down by type of media and gender. As of September 2016, about 15.5 percent of the male survey respondents stated they have paid for sports-related media such as books or magazines, whereas 5.1 of female internet users responded to have paid for the same media products.
Percentage of internet users who have paid for sports-related media in Japan as of September 2016, by type of media and gender
Basic Account
Get to know the platform
You only have access to basic statistics.
This statistic is not included in your account.
Starter Account
The ideal entry-level account for individual users
- Instant access to 1m statistics
- Download in XLS, PDF & PNG format
- Detailed references
$199 USD / Month *
Professional Account
Full access
Business Solutions including all features.
* Prices do not include sales tax.
Other statistics that may interest you Statistics on
About the industry
10
- Premium Statistic Media activity index in Russia 2020-2021, by type
- Premium Statistic Media usage time on workdays in Russia 2021, by type
- Premium Statistic Media usage time on weekends in Russia 2021, by type
- Premium Statistic Frequency of internet usage Philippines 2018
- Premium Statistic Content industry export value South Korea 2021, by segment
- Premium Statistic Export value content industry South Korea 2014-2021
- Premium Statistic Import value content industry South Korea 2014-2021
- Basic Statistic Sources used to access news in selected EU countries 2020
- Premium Statistic Preferred media types in Poland 2020
- Premium Statistic Preferred websites in Poland 2020
About the region
10
- Premium Statistic Attendance rate at live sports events in Japan 2023, by sport
- Premium Statistic Attitudes towards sports in Japan 2023
- Premium Statistic Sports club membership share Japan 2012-2021
- Premium Statistic Annual attendance professional motorcycle races Japan FY 2013-2022
- Premium Statistic SBI Sumishin Net Bank's customers by age group 2023
- Premium Statistic SBI Sumishin Net Bank's customers by gender 2023
- Premium Statistic PayPay Bank's number of bank accounts 2014-2023
- Premium Statistic PayPay Bank's customers by gender 2023
- Premium Statistic PayPay Bank's customers by age group 2023
- Premium Statistic SBI Sumishin Net Bank's net income FY 2013-2022
Selected statistics
2
Other regions
10
- Basic Statistic Europe: breakdown of sports technology startup companies 2018, by country
- Basic Statistic Online audience distribution of 90min.com in GB 2020, by educational attainment
- Premium Statistic Regular leisure activities of children in Germany 2018
- Premium Statistic Time spent on the internet via mobile per capita in MENA 2012-2020
- Premium Statistic Music industry sales revenue South Korea 2014-2022
- Premium Statistic Average time spent with media per week in Vietnam 2014 by type
- Premium Statistic Average time spent with media per week in Singapore 2014 by type
- Basic Statistic Online information sources ranked by importance in the United Kingdom (UK) 2015
- Premium Statistic Usage of selected media in Norway 2014-2016
- Basic Statistic Use of portable media devices among America's children in 2017
Related statistics
10
- Premium Statistic Average consumer expenses spent on music in the past six months Japan 2014-2023
- Premium Statistic Average consumer expenses on music in the past six months Japan 2023, by category
- Premium Statistic Newspaper circulation in Japan 2014-2023
- Premium Statistic Morning and evening newspaper circulation in Japan 2023
- Premium Statistic Twice-daily newspaper circulation in Japan 2014-2023
- Premium Statistic Morning edition newspaper circulation in Japan 2014-2023
- Premium Statistic Newspaper circulation per household in Japan 2014-2023
- Premium Statistic Publishing market size in Japan 2014-2023
- Premium Statistic Print book market size in Japan 2014-2023
- Premium Statistic Publishing market size in Japan 2023, by segment
Further related statistics
10
- UK console gaming reach 2015-2022, by gender
- Mobile internet use via laptops in Great Britain 2019, by demographic
- Revenues of VF Corporation's active segment worldwide 2016 to 2023
- Online advertising revenue in the U.S. 2012-2023, by half-year
- Breakdown of U.S. online ad revenue 2023, by format
- Revenue of Sohu in China 2022, by segment
- Net sales of Dick's Sporting Goods U.S. 2006-2022
- Baidu's total revenue 2013-2023
- The adidas Group's global footwear production from 2008-2023
- The adidas Group's EBITDA worldwide 2000-2023
Further Content: You might find this interesting as well
Statistics
- UK console gaming reach 2015-2022, by gender
- Mobile internet use via laptops in Great Britain 2019, by demographic
- Revenues of VF Corporation's active segment worldwide 2016 to 2023
- Online advertising revenue in the U.S. 2012-2023, by half-year
- Breakdown of U.S. online ad revenue 2023, by format
- Revenue of Sohu in China 2022, by segment
- Net sales of Dick's Sporting Goods U.S. 2006-2022
- Baidu's total revenue 2013-2023
- The adidas Group's global footwear production from 2008-2023
- The adidas Group's EBITDA worldwide 2000-2023
Macromill. (October 20, 2016). Percentage of internet users who have paid for sports-related media in Japan as of September 2016, by type of media and gender [Graph]. In Statista. Retrieved April 23, 2024, from https://www.statista.com/statistics/734885/japan-online-purchases-sports-related-media-by-gender/
Macromill. "Percentage of internet users who have paid for sports-related media in Japan as of September 2016, by type of media and gender." Chart. October 20, 2016. Statista. Accessed April 23, 2024. https://www.statista.com/statistics/734885/japan-online-purchases-sports-related-media-by-gender/
Macromill. (2016). Percentage of internet users who have paid for sports-related media in Japan as of September 2016, by type of media and gender. Statista. Statista Inc.. Accessed: April 23, 2024. https://www.statista.com/statistics/734885/japan-online-purchases-sports-related-media-by-gender/
Macromill. "Percentage of Internet Users Who Have Paid for Sports-related Media in Japan as of September 2016, by Type of Media and Gender." Statista, Statista Inc., 20 Oct 2016, https://www.statista.com/statistics/734885/japan-online-purchases-sports-related-media-by-gender/
Macromill, Percentage of internet users who have paid for sports-related media in Japan as of September 2016, by type of media and gender Statista, https://www.statista.com/statistics/734885/japan-online-purchases-sports-related-media-by-gender/ (last visited April 23, 2024)
Percentage of internet users who have paid for sports-related media in Japan as of September 2016, by type of media and gender [Graph], Macromill, October 20, 2016. [Online]. Available: https://www.statista.com/statistics/734885/japan-online-purchases-sports-related-media-by-gender/