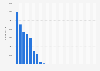
This statistic shows the coal rents as a percentage of the GDP in Thailand from 2009 to 2019. In 2019, the coal rents in the country amounted to approximately 0.02 percent of the GDP and therefore decreased from the previous year's 0.03 percent.
Coal rents in Thailand from 2009 to 2019 (percentage of GDP)
Basic Account
Get to know the platform
You only have access to basic statistics.
This statistic is not included in your account.
Starter Account
The ideal entry-level account for individual users
- Instant access to 1m statistics
- Download in XLS, PDF & PNG format
- Detailed references
$199 USD / Month *
Professional Account
Full access
Business Solutions including all features.
* Prices do not include sales tax.
Other statistics that may interest you Statistics on
About the industry
10
- Basic Statistic Coal rents in Indonesia 2012-2021
- Premium Statistic Coal rents in the Philippines 2009-2019
- Premium Statistic Coal rents as a share of GDP Bangladesh 2010-2019
- Premium Statistic Coal rents as a share of GDP Myanmar 2010-2019
- Premium Statistic Coal rents as a share of GDP APAC 2018, by country
- Premium Statistic Number of employees at Coal India FY 2003-2023
- Premium Statistic Global coal consumption 1998-2022
- Basic Statistic UK coal imports from Russia 2002-2022
- Premium Statistic Domestic coal demand in Indonesia 2020-2022
- Premium Statistic Coal export value in Colombia 2023, by region
About the region
10
- Premium Statistic Coal rents in Pakistan 2009-2019
- Premium Statistic Forecast coal consumption in CIS 2019-2050, by scenario
- Premium Statistic Coal production APAC 2013-2022
- Premium Statistic Coal consumption APAC 2013-2022
- Premium Statistic Natural gas rents APAC 2020, by country
- Premium Statistic Coal production APAC 2022, by country
- Premium Statistic Coal consumption APAC 2022, by country
- Premium Statistic Total natural resources rents APAC 2019, by country or region
- Premium Statistic Oil rents share of GDP APAC 2019, by country
- Basic Statistic Population density of Thailand 2011-2021
Selected statistics
7
- Premium Statistic Thermal coal prices 2013-2022
- Premium Statistic Coal consumption in South Africa 1998-2022
- Basic Statistic Coal consumption volume in China 1998-2022
- Premium Statistic Poland - coal consumption in oil equivalent 2009-2022
- Premium Statistic Proved coal reserves in China, by type 2011-2020
- Premium Statistic Number of employees at Yanzhou Coal Mining 2010-2020
- Basic Statistic Global projected coal demand by region in 2017 and 2023
Other regions
10
- Premium Statistic Peabody Energy's number of employees 2005-2023
- Basic Statistic Coal export volume in Russia 2014-2019, by type
- Basic Statistic Steam coal imports to the United Kingdom (UK) 2002-2022, by country
- Basic Statistic Coal imports to the UK from Canada 2002-2018
- Premium Statistic Mexico: coke import value 2012-2018
- Premium Statistic Value of solid fuels exported from Italy 2011-2018
- Premium Statistic Coal DMO in Indonesia 2019, by usage
- Premium Statistic Government revenue from coal royalties New Zealand FY 2009-2022
- Premium Statistic Coal production Mongolia 2013-2022
- Premium Statistic Leading coal mines in the U.S. by production 2022
Related statistics
10
- Premium Statistic Coal production Thailand 2013-2022
- Premium Statistic Coal consumption Thailand 2013-2022
- Premium Statistic Mobile vendors market share Thailand 2024
- Premium Statistic Share of Facebook users Thailand 2024, by gender
- Premium Statistic Number of tablet users in Thailand 2020-2029
- Premium Statistic Tablet penetration rate in Thailand 2020-2029
- Basic Statistic Mobile internet penetration rate in Thailand 2020-2029
- Basic Statistic Internet penetration rate in Thailand 2020-2029
- Premium Statistic Smartphone penetration rate in Thailand 2020-2029
- Basic Statistic Adolescent fertility rate Thailand 2012-2021
Further related statistics
10
- Global primary energy consumption 2022, by country
- Global natural gas production 2022, by country
- Primary energy consumption change in China 2000-2022
- Oil consumption in Canada 1990-2022
- Oil production in Venezuela 2008-2022
- Oil production in Libya 1998-2022
- OPEC's crude oil production 1998-2022
- Global oil production share 2022, by country
- Oil exports from the U.S. 1998-2022
- Oil exports from the Middle East 1998-2022
Further Content: You might find this interesting as well
Statistics
- Global primary energy consumption 2022, by country
- Global natural gas production 2022, by country
- Primary energy consumption change in China 2000-2022
- Oil consumption in Canada 1990-2022
- Oil production in Venezuela 2008-2022
- Oil production in Libya 1998-2022
- OPEC's crude oil production 1998-2022
- Global oil production share 2022, by country
- Oil exports from the U.S. 1998-2022
- Oil exports from the Middle East 1998-2022
World Bank. (October 8, 2021). Coal rents in Thailand from 2009 to 2019 (percentage of GDP) [Graph]. In Statista. Retrieved April 23, 2024, from https://www.statista.com/statistics/737727/thailand-coal-rents/
World Bank. "Coal rents in Thailand from 2009 to 2019 (percentage of GDP)." Chart. October 8, 2021. Statista. Accessed April 23, 2024. https://www.statista.com/statistics/737727/thailand-coal-rents/
World Bank. (2021). Coal rents in Thailand from 2009 to 2019 (percentage of GDP). Statista. Statista Inc.. Accessed: April 23, 2024. https://www.statista.com/statistics/737727/thailand-coal-rents/
World Bank. "Coal Rents in Thailand from 2009 to 2019 (Percentage of Gdp)." Statista, Statista Inc., 8 Oct 2021, https://www.statista.com/statistics/737727/thailand-coal-rents/
World Bank, Coal rents in Thailand from 2009 to 2019 (percentage of GDP) Statista, https://www.statista.com/statistics/737727/thailand-coal-rents/ (last visited April 23, 2024)
Coal rents in Thailand from 2009 to 2019 (percentage of GDP) [Graph], World Bank, October 8, 2021. [Online]. Available: https://www.statista.com/statistics/737727/thailand-coal-rents/