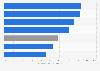
Population distribution of Daejeon, South Korea 2022, by district
In 2022, Seo-gu had the largest population among five districts in Daejeon in South Korea, with around 474.25 thousand inhabitants. That year, the total population of Daejeon stood at about 1.5 million.