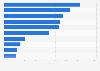
In 2018, sale of pharmaceuticals related to the treatment of the central nervous system accounted for about 17 percent of pharmacy sales in France. Cardiovascular pharmaceuticals represented over 9 percent of sales of medications sold in city pharmacies in France.
Breakdown of sales of pharmaceutical products in city pharmacies in France in 2018, by therapeutic class*
Loading statistic...
Basic Account
Get to know the platform
You only have access to basic statistics.
Starter Account
The ideal entry-level account for individual users
- Instant access to 1m statistics
- Download in XLS, PDF & PNG format
- Detailed references
$199 USD / Month *
Professional Account
Full access
Business Solutions including all features.
* Prices do not include sales tax.
Other statistics that may interest you Statistics on
About the industry
10
- Premium Statistic Volume of medicines dispensed in pharmacies reimbursed in France 2014, by class
- Premium Statistic R&D employment within the pharmaceutical industry in Spain 2008-2022
- Premium Statistic Net profit of Roche Farma SA in Spain 2013-2019
- Basic Statistic Turnover of medicines sold in retail pharmacies in France 2005-2018
- Premium Statistic Import value of pharmaceutical products in Spain 2022, by type
- Premium Statistic Import value of pharmaceutical products in Poland 2011-2022
- Premium Statistic Export value of pharmaceutical products in Poland 2011-2022
- Premium Statistic Pharma market imports in Peru 2022, by category
- Premium Statistic Sales revenue distribution of JW Pharmaceutical South Korea 2022, by channel
- Premium Statistic Value of dried glands, organs, and heparin imported by Spain 2005-2021
About the region
10
- Premium Statistic Breakdown of medical stays in France 2015, by hospital and specialty
- Premium Statistic Five-year survival chances for women victims of cancer in France 2005-2010
- Premium Statistic Boiron laboratories turnover in 2022, by region
- Premium Statistic Net profit of Boiron laboratories 2013-2022, per share
- Premium Statistic Net investments of Boiron laboratories 2014-2022
- Premium Statistic Boiron laboratories turnover in France 2022, by region
- Basic Statistic Number of employees of pharmaceutical companies by region France 2020
- Premium Statistic Total liabilities of the Ipsen group 2014-2019
- Premium Statistic Total equity of the Ipsen group 2014-2019
- Basic Statistic Turnover of medicines distributed in hospitals in France 2010-2018
Selected statistics
6
- Premium Statistic Pfizer's ad spending 2006-2023
- Premium Statistic Number of employees at Sinopharm 2011-2022
- Premium Statistic Revenue of Sinopharm 2011-2022, by category
- Premium Statistic Annual revenue of Sinopharm 2010-2022
- Premium Statistic Annual revenue of Shanghai Pharmaceuticals 2011-2022
- Basic Statistic M&A capacities - changes for the global pharma industry 2008-2015
Other regions
10
- Premium Statistic Net sales of drugs in pharmacies in Spain 2012-2022
- Premium Statistic Metabolic & digestive pharmaceuticals revenue in Argentina 2017-2022
- Basic Statistic Leading dispensed laxatives in England 2022, by item number
- Basic Statistic Number of users of hypertension medicine in Sweden 2022, by age and gender
- Basic Statistic Prescription medicines: U.S. spending growth 2000-2022
- Basic Statistic Beta-lactam antibacterials and penicillins systemic use: consumption in Europe 2022
- Basic Statistic Antibacterials for systemic use: consumption in Finland 2022
- Basic Statistic Number of consumers of pharmaceutical drugs in Italy 2010-2022
- Basic Statistic Compensation of dispensed thyroid in the Netherlands per user 2014-2022
- Premium Statistic Average number of prescriptions filled by Canadians 2018, by age
Related statistics
10
- Basic Statistic U.S. pediatric hospital stay cost distribution in 2016, by diagnostic category
- Basic Statistic U.S. hospital costs for patients under 21 years in 2016, by diagnostic category
- Basic Statistic U.S. average cost per pediatric hospital stay in 2016, by diagnostic category
- Premium Statistic Turnover of Boiron laboratories abroad 2012-2022
- Premium Statistic Distribution of the Boiron laboratories workforce in 2022, by world region
- Premium Statistic EBITDA of Boiron laboratories 2012-2022
- Premium Statistic Income after tax, profit-sharing, amortizations and reserves of Boiron 2022
- Premium Statistic Cashflow of Boiron laboratories 2013-2022
- Premium Statistic Boiron laboratories' European turnover in 2022, by country
- Premium Statistic Average full-time equivalent workforce of Boiron Laboratories 2012-2022
Further related statistics
9
- AstraZeneca's revenue from top product Pulmicort 2006-2023
- Chinese insulin market distribution: leading companies 2011
- U.S. insulin market distribution: leading companies 2011
- Merck & Co total assets 2009-2023
- AstraZeneca's expenditure on research and development 2006-2023
- CVS Health's total assets 2005-2023
- Walgreens gross profit and net earnings in the U.S. 2005-2023
- Expenditure worldwide on diabetes by market 2013-2018
- Global pharmaceutical pipeline by therapy area 2013-2017
Further Content: You might find this interesting as well
Statistics
- AstraZeneca's revenue from top product Pulmicort 2006-2023
- Chinese insulin market distribution: leading companies 2011
- U.S. insulin market distribution: leading companies 2011
- Merck & Co total assets 2009-2023
- AstraZeneca's expenditure on research and development 2006-2023
- CVS Health's total assets 2005-2023
- Walgreens gross profit and net earnings in the U.S. 2005-2023
- Expenditure worldwide on diabetes by market 2013-2018
- Global pharmaceutical pipeline by therapy area 2013-2017
LEEM. (September 16, 2019). Breakdown of sales of pharmaceutical products in city pharmacies in France in 2018, by therapeutic class* [Graph]. In Statista. Retrieved April 19, 2024, from https://www.statista.com/statistics/764593/sales-products-pharmaceutical-pharmacy-class-therapeutic-la-france/
LEEM. "Breakdown of sales of pharmaceutical products in city pharmacies in France in 2018, by therapeutic class* ." Chart. September 16, 2019. Statista. Accessed April 19, 2024. https://www.statista.com/statistics/764593/sales-products-pharmaceutical-pharmacy-class-therapeutic-la-france/
LEEM. (2019). Breakdown of sales of pharmaceutical products in city pharmacies in France in 2018, by therapeutic class* . Statista. Statista Inc.. Accessed: April 19, 2024. https://www.statista.com/statistics/764593/sales-products-pharmaceutical-pharmacy-class-therapeutic-la-france/
LEEM. "Breakdown of Sales of Pharmaceutical Products in City Pharmacies in France in 2018, by Therapeutic Class* ." Statista, Statista Inc., 16 Sep 2019, https://www.statista.com/statistics/764593/sales-products-pharmaceutical-pharmacy-class-therapeutic-la-france/
LEEM, Breakdown of sales of pharmaceutical products in city pharmacies in France in 2018, by therapeutic class* Statista, https://www.statista.com/statistics/764593/sales-products-pharmaceutical-pharmacy-class-therapeutic-la-france/ (last visited April 19, 2024)
Breakdown of sales of pharmaceutical products in city pharmacies in France in 2018, by therapeutic class* [Graph], LEEM, September 16, 2019. [Online]. Available: https://www.statista.com/statistics/764593/sales-products-pharmaceutical-pharmacy-class-therapeutic-la-france/