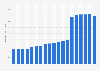
This statistic shows the number of Euro Disney group layoffs in France between 2013 and 2016. Thus, in 2015, there were nearly 240 redundancies within the group.
Breakdown of the number of redundancies of the Euro Disney group in France between 2013 and 2016
Basic Account
Get to know the platform
You only have access to basic statistics.
This statistic is not included in your account.
Starter Account
The ideal entry-level account for individual users
- Instant access to 1m statistics
- Download in XLS, PDF & PNG format
- Detailed references
$199 USD / Month *
Professional Account
Full access
Business Solutions including all features.
* Prices do not include sales tax.
Other statistics that may interest you Statistics on
About the industry
10
- Premium Statistic Number of Euro Disney hires in France 2013-2016, by company
- Premium Statistic Share of Euro Disney group employees by seniority in France 2013-2016
- Premium Statistic Share of Euro Disney employees in France 2013-2016, by age
- Premium Statistic Number of Euro Disney group employees in France 2013-2016
- Premium Statistic Revenue from Euro Disney's tourist activities in France 2012-2016
- Premium Statistic Euro Disney Group net income in the world 2013-2016
- Premium Statistic Marketing expenses and revenue of Euro Disney in France 2012-2016
- Premium Statistic Arrival of international tourists in Saudi Arabia 2012-2021
- Premium Statistic Arrival of international tourists in Bahrain 2012-2021
- Premium Statistic Arrival of international tourists in the GCC 2021, by country
About the region
9
- Premium Statistic Revenue of hotels and Disney Village in Disneyland Paris 2012-2016
- Premium Statistic Italy: number of overnight stays of French tourist in 2015, by region of destination
- Premium Statistic Ranking of hotel groups according to the number of rooms in France 2016
- Premium Statistic Number of visitors to Disneyland Paris theme park in France 2009-2022
- Premium Statistic Value of commercial real estate investment in France 2021-Q1 2022, by type
- Premium Statistic Average price of residential property in France 2023, by property type
- Premium Statistic Average rent per square meter for apartments in France 2023, by city
- Premium Statistic Breakdown of housings in France 2020, by square meter price
- Premium Statistic Number of hotel overnight stays spent in Auvergne-Rhône-Alpes in France 2013-2019
Selected statistics
7
- Basic Statistic Foreign exchange earnings from tourism in India 2000-2022
- Premium Statistic Annual revenue of China Tourism Group Duty Free 2013-2023
- Premium Statistic Countries with the highest number of inbound tourist arrivals worldwide 2019-2022
- Premium Statistic Countries with the highest outbound tourism expenditure worldwide 2019-2022
- Basic Statistic Number of international tourist arrivals in India 2010-2021
- Premium Statistic Leading countries in the MEA in the Travel & Tourism Competitiveness Index 2018
- Premium Statistic Change in number of visitors from Mexico to the U.S. 2018-2024
Other regions
9
- Premium Statistic Number of hotels above designated size in China 2006-2022
- Premium Statistic Average occupancy rate of hotels in Antwerp 2009-2019
- Premium Statistic Total revenue of tourist hotels in Taiwan 2012-2022, by origin of funds
- Premium Statistic Operating profit of Olav Thon Group 2012-2018
- Basic Statistic Accommodation establishments declared essential by the Government in Spain March 2020
- Premium Statistic Quarterly COVID-19 impact on revPAR in India 2020-2022
- Basic Statistic H.I.S.'s net sales FY 2014-2022
- Premium Statistic H.I.S.'s employee numbers FY 2014-2022
- Premium Statistic Number of hotels and similar establishments operating in Morocco 2010-2019
Related statistics
10
- Basic Statistic Leading travel markets in the Netherlands 2019-2022, by hotel overnight stays
- Premium Statistic Most visited tourist attractions in the UK 2019-2023
- Premium Statistic Number of holidays taken by Italians 2022, by purpose and length of stay
- Premium Statistic Average price for hotel rooms in Brussels-Capital Region 2014-2020, by star rating
- Premium Statistic Average occupancy rate of hotels in Brussels-Capital Region 2014-2020
- Premium Statistic Average occupancy rate of hotels in Brussels-Capital Region 2020, by month
- Premium Statistic Number of accommodations in Brussels-Capital Region 2020, by type
- Premium Statistic Average price for hotel rooms in Brussels-Capital Region 2014-2020
- Premium Statistic Attendance at the Heineken Experience in the Netherlands 2011-2020
- Premium Statistic Occupancy rate of hotels in the Italian city of Venice 2014-2019
Further related statistics
10
- Operating income of the InterContinental Hotels Group 2007-2023
- Total assets of the InterContinental Hotels Group 2007-2023
- Income of the InterContinental Hotels Group 2007-2023
- Revenue of the InterContinental Hotels Group 2008-2023, by ownership type
- Percentage change in amusement and theme park attendance in North America 2019-2022
- Number of Candlewood Suites hotel rooms worldwide 2008-2023
- Number of employees of the InterContinental Hotel Group 2023
- Number of Crowne Plaza hotels worldwide 2008-2023
- Revenue of the InterContinental Hotels Group 2007-2023
- Operating income of Marriott International worldwide 2007-2023
Further Content: You might find this interesting as well
Statistics
- Operating income of the InterContinental Hotels Group 2007-2023
- Total assets of the InterContinental Hotels Group 2007-2023
- Income of the InterContinental Hotels Group 2007-2023
- Revenue of the InterContinental Hotels Group 2008-2023, by ownership type
- Percentage change in amusement and theme park attendance in North America 2019-2022
- Number of Candlewood Suites hotel rooms worldwide 2008-2023
- Number of employees of the InterContinental Hotel Group 2023
- Number of Crowne Plaza hotels worldwide 2008-2023
- Revenue of the InterContinental Hotels Group 2007-2023
- Operating income of Marriott International worldwide 2007-2023
Euro Disney, & AMF. (February 17, 2017). Breakdown of the number of redundancies of the Euro Disney group in France between 2013 and 2016 [Graph]. In Statista. Retrieved April 19, 2024, from https://www.statista.com/statistics/766818/euro-disney-number-layoffs-france/
Euro Disney, und AMF. "Breakdown of the number of redundancies of the Euro Disney group in France between 2013 and 2016." Chart. February 17, 2017. Statista. Accessed April 19, 2024. https://www.statista.com/statistics/766818/euro-disney-number-layoffs-france/
Euro Disney, AMF. (2017). Breakdown of the number of redundancies of the Euro Disney group in France between 2013 and 2016. Statista. Statista Inc.. Accessed: April 19, 2024. https://www.statista.com/statistics/766818/euro-disney-number-layoffs-france/
Euro Disney, and AMF. "Breakdown of The Number of Redundancies of The Euro Disney Group in France between 2013 and 2016." Statista, Statista Inc., 17 Feb 2017, https://www.statista.com/statistics/766818/euro-disney-number-layoffs-france/
Euro Disney & AMF, Breakdown of the number of redundancies of the Euro Disney group in France between 2013 and 2016 Statista, https://www.statista.com/statistics/766818/euro-disney-number-layoffs-france/ (last visited April 19, 2024)
Breakdown of the number of redundancies of the Euro Disney group in France between 2013 and 2016 [Graph], Euro Disney, & AMF, February 17, 2017. [Online]. Available: https://www.statista.com/statistics/766818/euro-disney-number-layoffs-france/