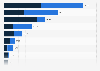
This statistic shows the total number of establishments in the tourism, hotel, restaurant and leisure activities sector in Corsica in 2013, by department. There were about 1,500 tourism establishments in South Corsica (2A) that year.
Total number of establishments in the tourism, hotel, catering and leisure activities sector in Corsica in 2013, by department
Loading statistic...
Basic Account
Get to know the platform
You only have access to basic statistics.
Starter Account
The ideal entry-level account for individual users
- Instant access to 1m statistics
- Download in XLS, PDF & PNG format
- Detailed references
$149 USD / Month *
Professional Account
Full access
Business Solutions including all features.
* Prices do not include sales tax.
Other statistics that may interest you Statistics on
About the industry
10
- Premium Statistic Tourist spending in France 2018, by expenditure item
- Premium Statistic Tourist consumption loss due to COVID-19 in Italy 2020, by sector
- Premium Statistic Employment in the tourism industry in Turkey 2019, by sector
- Premium Statistic "Q de calidad": tourist establishments awarded in Spain in 2020, by type
- Basic Statistic COVID-19 employment measures in the hospitality equipment sector Spain 2020
- Premium Statistic Share of employment in tourism in Grand Est, France 2014-2016, by sector
- Premium Statistic Share of investments in tourism in Grand Est, France 2014-2016, by sector
- Premium Statistic Mexico: share of paid jobs in tourism by service type 2017
- Premium Statistic Employment in the tourism industry in Auvergne-Rhône-Alpes, France 2017, by service
- Premium Statistic United States travel industry gross bookings and revenue by segment 2009 and 2017
About the region
10
- Premium Statistic Share of seasonal jobs in the tourism sector France 2014, by region and season
- Premium Statistic Number of employees in the tourism sector in PACA 2013
- Premium Statistic Distribution of stores in shopping centers in France 2018, by type
- Basic Statistic Accommodation & food service industry turnover in France 2009-2020
- Premium Statistic Most visited animal zoos and animal parks in France 2021
- Premium Statistic Breakdown of household consumption expenditure in France 2017-2020, by item
- Basic Statistic Hotels and restaurants: revenue from online sales France 2008-2019
- Basic Statistic French cities with the largest number of fast-food restaurants 2021
- Premium Statistic Tourism investment in restaurants and cafes France 2018
- Basic Statistic Types of food service businesses offering organic products in France 2019
Selected statistics
4
- Basic Statistic Foreign exchange earnings from tourism in India 2000-2022
- Premium Statistic Annual revenue of China Tourism Group Duty Free 2012-2022
- Basic Statistic Number of international tourist arrivals in India 2010-2021
- Premium Statistic Change in number of visitors from Mexico to the U.S. 2018-2024
Other regions
10
- Premium Statistic "Q de Calidad": tourist establishments awarded in Galicia (Spain) in 2017, by type
- Basic Statistic Hospitality & tourism: number of chefs and cooks in the UK 2007-2011
- Premium Statistic Sufficiency of financial buffers in hospitality sector coronavirus Netherlands 2020
- Premium Statistic Market value of food services in Singapore 2018, by sub sector
- Premium Statistic Number of employees in food and beverage establishments Malaysia 2012-2021
- Basic Statistic Greece: turnover of the accommodation & food service activities industry 2011-2020
- Premium Statistic Employees in food and beverage serving in Australia 2011-2020
- Premium Statistic Reluctance to go to restaurants and leisure facilities alone in Japan 2020
- Premium Statistic Average occupancy rate of hotels in Antwerp 2009-2019
- Premium Statistic GVA of accommodation and food services in Northern Ireland 2000 to 2017
Related statistics
10
- Premium Statistic Occupancy rate decrease in hospitality due to coronavirus in the Netherlands 2020
- Premium Statistic Revenue percentage loss in the hospitality sector due to coronavirus Netherlands 2020
- Premium Statistic Number of restaurants in the Netherlands 2010-2022
- Premium Statistic Employees of retail and catering businesses in Italy 2019-2020, by type of contract
- Premium Statistic Number of workers at delis, chip shops, and similar services in Italy 2020, by month
- Premium Statistic Turnover of accommodation and food service activities in Italy 2016-2018, by sector
- Premium Statistic Overnight stays for holiday trips by Italians 2019, by tourist's age and gender
- Premium Statistic Share of overnight stays for trips by Italians 2019, by professional status
- Basic Statistic Revenue index of the hospitality industry in the Netherlands 2015-2020
- Basic Statistic Volume index of the hospitality industry in the Netherlands 2015-2020
Further related statistics
10
- Number of Wendy's restaurants worldwide 2011-2022, by mode of operation
- Total assets of Wendy's 2009-2022
- Number of Applebee's restaurants worldwide 2008-2022, by region
- Number of International House of Pancakes restaurants worldwide 2008-2022, by region
- Operating income of Dine Brands Global worldwide 2008-2022
- Net income of Dine Brands Global worldwide 2008-2022
- Sales of International House of Pancakes (IHOP) restaurants in the U.S. 2009-2022
- Operating income of Yum! Brands 2012-2022
- Franchise and property revenues of Yum! Brands 2012-2022
- Number of countries where Yum! Brands operates 2010-2022, by brand
Further Content: You might find this interesting as well
Statistics
- Number of Wendy's restaurants worldwide 2011-2022, by mode of operation
- Total assets of Wendy's 2009-2022
- Number of Applebee's restaurants worldwide 2008-2022, by region
- Number of International House of Pancakes restaurants worldwide 2008-2022, by region
- Operating income of Dine Brands Global worldwide 2008-2022
- Net income of Dine Brands Global worldwide 2008-2022
- Sales of International House of Pancakes (IHOP) restaurants in the U.S. 2009-2022
- Operating income of Yum! Brands 2012-2022
- Franchise and property revenues of Yum! Brands 2012-2022
- Number of countries where Yum! Brands operates 2010-2022, by brand
Fafih. (January 1, 2016). Total number of establishments in the tourism, hotel, catering and leisure activities sector in Corsica in 2013, by department [Graph]. In Statista. Retrieved December 09, 2023, from https://www.statista.com/statistics/769577/number-settlements-sector-tourism-corsica-department/
Fafih. "Total number of establishments in the tourism, hotel, catering and leisure activities sector in Corsica in 2013, by department." Chart. January 1, 2016. Statista. Accessed December 09, 2023. https://www.statista.com/statistics/769577/number-settlements-sector-tourism-corsica-department/
Fafih. (2016). Total number of establishments in the tourism, hotel, catering and leisure activities sector in Corsica in 2013, by department. Statista. Statista Inc.. Accessed: December 09, 2023. https://www.statista.com/statistics/769577/number-settlements-sector-tourism-corsica-department/
Fafih. "Total Number of Establishments in The Tourism, Hotel, Catering and Leisure Activities Sector in Corsica in 2013, by Department." Statista, Statista Inc., 1 Jan 2016, https://www.statista.com/statistics/769577/number-settlements-sector-tourism-corsica-department/
Fafih, Total number of establishments in the tourism, hotel, catering and leisure activities sector in Corsica in 2013, by department Statista, https://www.statista.com/statistics/769577/number-settlements-sector-tourism-corsica-department/ (last visited December 09, 2023)
Total number of establishments in the tourism, hotel, catering and leisure activities sector in Corsica in 2013, by department [Graph], Fafih, January 1, 2016. [Online]. Available: https://www.statista.com/statistics/769577/number-settlements-sector-tourism-corsica-department/