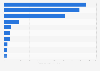
Energy consumption of Alphabet (Google) from financial year 2011 to 2020 (in gigawatt hours)
Loading statistic...
Basic Account
Get to know the platform
You only have access to basic statistics.
Starter Account
The ideal entry-level account for individual users
- Instant access to 1m statistics
- Download in XLS, PDF & PNG format
- Detailed references
$69 USD $49 USD / Month *
in the first 12 months
Professional Account
Full access
Business Solutions including all features.
* Prices do not include sales tax.
Other statistics that may interest you
Company financials
8
- Basic Statistic Alphabet: global annual revenue 2011-2022
- Basic Statistic Alphabet: quarterly revenue 2014-2023
- Basic Statistic Alphabet: quarterly net income 2014-2023
- Basic Statistic Alphabet: global annual revenue 2017-2022, by segment
- Basic Statistic Google: global annual revenue 2002-2022
- Basic Statistic Google: revenue distribution 2017-2022, by segment
- Basic Statistic Google: annual advertising revenue 2001-2022
- Basic Statistic Google sites: advertising revenue 2001-2022
Benchmark
7
- Basic Statistic Market value of the largest internet companies worldwide 2023
- Basic Statistic Market capitalization of the largest U.S. internet companies 2023
- Basic Statistic Apple, Google, and Microsoft: revenue comparison 2008-2022
- Basic Statistic Most valuable brands worldwide 2022
- Premium Statistic Biggest revenue source of leading tech companies 2022
- Basic Statistic Most visited multi-platform U.S. web properties 2023
- Premium Statistic Reach of most popular U.S. smartphone apps 2023
Search
7
- Basic Statistic Leading Google search queries worldwide 2022
- Basic Statistic Global market share of leading desktop search engines 2015-2023
- Premium Statistic Google: desktop search market share in selected countries 2023
- Basic Statistic Google search engine global mobile market share 2015-2022
- Premium Statistic Leading U.S. search engines by share of core searches 2008-2022
- Premium Statistic Leading U.S. search engines by number of core searches 2008-2022
- Premium Statistic Leading shifts in SEO worldwide 2022
YouTube
6
- Premium Statistic Global YouTube advertising revenues 2017-2022
- Basic Statistic YouTube: share of Google revenues 2017-2022
- Basic Statistic YouTube: global advertising revenues as of Q4 2023
- Basic Statistic Most viewed YouTube videos of all time 2023
- Basic Statistic YouTube: most viewed channels 2023
- Premium Statistic Most popular U.S. YouTube partner channels 2022, ranked by viewers
Google Play
7
- Premium Statistic Global Google Play and Apple App Store app revenues 2022
- Basic Statistic Global Google Play app downloads 2016-2022
- Basic Statistic Google Play: number of available apps 2009-2023
- Premium Statistic Average price of paid Android apps 2023
- Basic Statistic Leading Android gaming app publishers worldwide 2022, by revenue
- Premium Statistic Leading non-gaming Android app publishers worldwide 2022, by revenue
- Basic Statistic Google Play: quarterly growth of available apps as 2015-2022
Government
6
- Basic Statistic Government requests for content removal from Google H1 2022
- Basic Statistic Number of infringing URLs requested to be removed from Google Search 2022
- Premium Statistic Google user data requests by U.S. federal authorities 2010-2022
- Basic Statistic Google user data requests from federal agencies and governments H1 2022, by country
- Basic Statistic Google: quarterly federal lobbying expenses 2010-2022
- Basic Statistic EU Commission Google antitrust fines 2017-2022
Environmental impact
6
- Premium Statistic EPA Green Power Partnership's leading green power users in the U.S. 2022
- Premium Statistic EPA Green Power Partnership's Fortune 500 green power users in the U.S. 2022
- Premium Statistic Google: GHG emissions FY 2011-2020
- Premium Statistic Google: carbon intensity FY 2011-2020
- Basic Statistic Google: energy consumption FY 2011-2020
- Premium Statistic Google: waste generation FY 2015-2020
Further related statistics
18
- Energy consumption of renewable energy in the manufacturing sector Thailand 2011-2020
- Google's cumulative renewable energy capacity FY 2011-2020
- Final energy consumption in Germany in 2021, by energy carrier
- Energy consumption from renewable sources in Italy 2017, by region
- Energy consumption of electricity in the manufacturing sector Thailand 2011-2020
- Lockheed Martin's energy consumption 2010-2015
- Share of Google's electricity use from renewable sources 2012-2017
- Energy consumption distribution in Finland 2010-2020, by energy source
- Energy consumption in Finland 2021
- Energy consumption distribution in Finland 2019, by energy source
- Primary energy consumption in India 2019-2021, by fuel
- U.S. renewable energy consumption 2015-2024, by sector
- Hydro power consumption in Finland 2007-2017
- Energy consumption in Finland 2007-2017
- Electricity consumption of the transportation sector Thailand 2011-2020
- Final energy consumption agriculture, mining, construction Japan FY 2012-2021
- Reasons to complain about the natural gas operator services Spain 2017-2019
- Pirelli Group: total energy consumption 2014-2016
Further Content: You might find this interesting as well
Statistics
- Energy consumption of renewable energy in the manufacturing sector Thailand 2011-2020
- Google's cumulative renewable energy capacity FY 2011-2020
- Final energy consumption in Germany in 2021, by energy carrier
- Energy consumption from renewable sources in Italy 2017, by region
- Energy consumption of electricity in the manufacturing sector Thailand 2011-2020
- Lockheed Martin's energy consumption 2010-2015
- Share of Google's electricity use from renewable sources 2012-2017
- Energy consumption distribution in Finland 2010-2020, by energy source
- Energy consumption in Finland 2021
- Energy consumption distribution in Finland 2019, by energy source
- Primary energy consumption in India 2019-2021, by fuel
- U.S. renewable energy consumption 2015-2024, by sector
- Hydro power consumption in Finland 2007-2017
- Energy consumption in Finland 2007-2017
- Electricity consumption of the transportation sector Thailand 2011-2020
- Final energy consumption agriculture, mining, construction Japan FY 2012-2021
- Reasons to complain about the natural gas operator services Spain 2017-2019
- Pirelli Group: total energy consumption 2014-2016
Google. (March 8, 2022). Energy consumption of Alphabet (Google) from financial year 2011 to 2020 (in gigawatt hours) [Graph]. In Statista. Retrieved June 05, 2023, from https://www.statista.com/statistics/788540/energy-consumption-of-google/?ref=greenwashed.earth
Google. "Energy consumption of Alphabet (Google) from financial year 2011 to 2020 (in gigawatt hours)." Chart. March 8, 2022. Statista. Accessed June 05, 2023. https://www.statista.com/statistics/788540/energy-consumption-of-google/?ref=greenwashed.earth
Google. (2022). Energy consumption of Alphabet (Google) from financial year 2011 to 2020 (in gigawatt hours). Statista. Statista Inc.. Accessed: June 05, 2023. https://www.statista.com/statistics/788540/energy-consumption-of-google/?ref=greenwashed.earth
Google. "Energy Consumption of Alphabet (Google) from Financial Year 2011 to 2020 (in Gigawatt Hours)." Statista, Statista Inc., 8 Mar 2022, https://www.statista.com/statistics/788540/energy-consumption-of-google/?ref=greenwashed.earth
Google, Energy consumption of Alphabet (Google) from financial year 2011 to 2020 (in gigawatt hours) Statista, https://www.statista.com/statistics/788540/energy-consumption-of-google/?ref=greenwashed.earth (last visited June 05, 2023)
Energy consumption of Alphabet (Google) from financial year 2011 to 2020 (in gigawatt hours) [Graph], Google, March 8, 2022. [Online]. Available: https://www.statista.com/statistics/788540/energy-consumption-of-google/?ref=greenwashed.earth