Social media usage China 2017, by age group
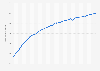
The graph describes the penetration rate of social media in China in 2017, broken down by age group. In that year, more than 69 percent of Chinese people aged from 15 to 19 years were social media users.