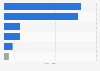
The statistic depicts the production index of the mining and manufacturing industry in Japan from 2010 to 2015. In 2015, the mining and manufacturing production index stood at 98.1, compared to the index year 2010.
Production index of the mining and manufacturing industry in Japan from 2010 to 2015
Basic Account
Get to know the platform
You only have access to basic statistics.
This statistic is not included in your account.
Starter Account
The ideal entry-level account for individual users
- Instant access to 1m statistics
- Download in XLS, PDF & PNG format
- Detailed references
$199 USD / Month *
Professional Account
Full access
Business Solutions including all features.
* Prices do not include sales tax.
Other statistics that may interest you Statistics on
About the industry
10
- Premium Statistic FDI flows into Japan 2022, by manufacturing industry
- Premium Statistic PPI for machinery and equipment Thailand 2009-2022
- Premium Statistic PPI for fishery products Thailand 2009-2022
- Premium Statistic PPI for electrical equipment Thailand 2009-2022
- Premium Statistic PPI for food products Thailand 2009-2022
- Premium Statistic PPI for vehicles, parts and accessories Thailand 2009-2022
- Premium Statistic PPI for textiles Thailand 2009-2022
- Premium Statistic PPI for intermediate materials Thailand 2009-2022
- Premium Statistic PPI for leather products Thailand 2009-2022
- Premium Statistic PPI for intermediate industrial materials Thailand 2009-2022
About the region
10
- Premium Statistic Share of companies with variable working hour systems Japan 2014-2023
- Premium Statistic Self-employment women numbers Japan 2000-2015
- Premium Statistic Margarine production volume in Japan 2013-2022
- Premium Statistic Sodium glutamate production volume in Japan 2011-2020
- Premium Statistic Jam production volume in Japan 2012-2021
- Premium Statistic Ham production volume in Japan 2012-2021
- Premium Statistic Liquor production volume in Japan FY 2012-2021
- Premium Statistic Canned food production volume in Japan 2012-2021
- Premium Statistic Wheat flour production volume in Japan FY 2011-2020
- Premium Statistic Retort pouch food production volume in Japan 2012-2021
Other regions
10
- Basic Statistic U.S. monthly change in nonfarm payroll employment 2024, by industry
- Basic Statistic Manufacturing of food products: number of employees in the Czech Republic 2012-2021
- Basic Statistic Manufacturing of food products: number of employees in Turkey 2009-2014
- Premium Statistic Global manufacturing employment change - selected countries 1997-2016
- Premium Statistic Views on employers prioritizing nationals over immigrants in Belgium 2019
- Basic Statistic Growth rate of sales and service income in Australia FY 2017 by key industries
- Basic Statistic Manufacturing of food products: number of employees in Greece 2012-2021
- Basic Statistic Manufacturing of food products: number of employees in Denmark 2012-2021
- Basic Statistic Manufacturing of food products: number of employees in Finland 2012-2021
- Basic Statistic Netherlands: number of employees in the chemicals manufacturing industry 2010-2021
Related statistics
10
- Premium Statistic Share of reasons for unemployment Japan 2015
- Premium Statistic Overseas affiliates' sales value in the manufacturing industry in Japan FY 2012-2021
- Premium Statistic Overseas affiliates production ratio in manufacturing industry in Japan 2012-2021
- Premium Statistic Share of men among employed people Japan 2022, by occupation
- Premium Statistic Number of people employed in the secondary sector Japan 2022, by industry
- Premium Statistic Number of businesses operating the secondary sector in Japan 2016, by industry
- Premium Statistic Average days of holidays granted Japan 2013-2022
- Premium Statistic Average days of holidays taken Japan 2013-2022
- Premium Statistic Prioritization between work and private life among young people Japan 2019
- Premium Statistic Preferred job locations of young people Japan 2019
Further related statistics
10
- Number of Rio Tinto's employees 2010-2023
- Annual silver production of Coeur Mining 2010-2021
- Biofuels related jobs worldwide by region 2019
- Agnico-Eagle Mines' average gold price realized 2010-2022
- Agnico-Eagle Mines' gold reserves 2000-2022
- Glencore's net income 2010-2023
- Glencore's sales of energy products 2010-2023
- Rio Tinto's net income 2005-2023
- Rio Tinto's uranium production 2010-2023
- Rio Tinto's diamond production 2010-2023
Further Content: You might find this interesting as well
Statistics
- Number of Rio Tinto's employees 2010-2023
- Annual silver production of Coeur Mining 2010-2021
- Biofuels related jobs worldwide by region 2019
- Agnico-Eagle Mines' average gold price realized 2010-2022
- Agnico-Eagle Mines' gold reserves 2000-2022
- Glencore's net income 2010-2023
- Glencore's sales of energy products 2010-2023
- Rio Tinto's net income 2005-2023
- Rio Tinto's uranium production 2010-2023
- Rio Tinto's diamond production 2010-2023
The Japan Institute for Labour Policy and Training. (March 1, 2017). Production index of the mining and manufacturing industry in Japan from 2010 to 2015 [Graph]. In Statista. Retrieved April 25, 2024, from https://www.statista.com/statistics/797840/japan-mining-and-manufacturing-production-index/
The Japan Institute for Labour Policy and Training. "Production index of the mining and manufacturing industry in Japan from 2010 to 2015." Chart. March 1, 2017. Statista. Accessed April 25, 2024. https://www.statista.com/statistics/797840/japan-mining-and-manufacturing-production-index/
The Japan Institute for Labour Policy and Training. (2017). Production index of the mining and manufacturing industry in Japan from 2010 to 2015. Statista. Statista Inc.. Accessed: April 25, 2024. https://www.statista.com/statistics/797840/japan-mining-and-manufacturing-production-index/
The Japan Institute for Labour Policy and Training. "Production Index of The Mining and Manufacturing Industry in Japan from 2010 to 2015." Statista, Statista Inc., 1 Mar 2017, https://www.statista.com/statistics/797840/japan-mining-and-manufacturing-production-index/
The Japan Institute for Labour Policy and Training, Production index of the mining and manufacturing industry in Japan from 2010 to 2015 Statista, https://www.statista.com/statistics/797840/japan-mining-and-manufacturing-production-index/ (last visited April 25, 2024)
Production index of the mining and manufacturing industry in Japan from 2010 to 2015 [Graph], The Japan Institute for Labour Policy and Training, March 1, 2017. [Online]. Available: https://www.statista.com/statistics/797840/japan-mining-and-manufacturing-production-index/