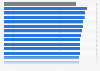
This statistic shows the labor force participation rate in the United States in 2020, by age and gender. In 2020, 89.7 percent of males ages 35 to 44 participated in the labor force in the U.S.
Labor force participation rate in the United States in 2020, by age and sex
Basic Account
Get to know the platform
You only have access to basic statistics.
This statistic is not included in your account.
Starter Account
The ideal entry-level account for individual users
- Instant access to 1m statistics
- Download in XLS, PDF & PNG format
- Detailed references
$59 USD $39 USD / Month *
in the first 12 months
Professional Account
Full access
Business Solutions including all features.
* Prices do not include sales tax.
Statistics on Generation gap in the U.S.
Overview
3
Demographics
4
Income and employment
7
- Premium Statistic Mean personal money earnings in the U.S. by age 2019
- Basic Statistic U.S. gender pay gap by age group Q4 2022
- Premium Statistic Number of minimum wage workers in the U.S. by age 2021
- Basic Statistic Percentage of low wage workers in the U.S. by age 2021
- Basic Statistic U.S. unemployment rate by age 1990-2022
- Basic Statistic U.S. long-term unemployment rate in 2022, by age
- Premium Statistic Number of retired Social Security beneficiaries in the U.S. 2022, by age
Costs and budgets
5
- Basic Statistic Average annual charges for higher education in the U.S. 1970-2021
- Basic Statistic Average debt of university graduates in the U.S. 2003-2019
- Premium Statistic Homeownership expectations of adults in the United States in 2020, by generation
- Premium Statistic COVID-19 effect on U.S. homeownership plans 2020, by generation
- Premium Statistic Estimated cost of life insurance in the U.S. 2020, by generation
Opinions
4
- Premium Statistic Leading economic concerns in the United States as of June 2021, by generation
- Premium Statistic U.S. adults' views same-sex marriage by generation 2001-2019
- Premium Statistic Trust in government by generation U.S. 1972-2021
- Basic Statistic Opinion of U.S. adults on whether billionaires are a good or bad thing 2021, by age
Further related statistics
15
- Labor force in the U.S. in 2017, by generation
- Number of people in the labor force Canada 2022, by province
- Number of Aboriginals and Torres Strait Islanders unemployed Australia FY 2015 by age
- Selected difficulties finding work indigenous people Australia FY 2015 by age
- Share of employed people aged 65 years or older South Korea 1998-2020
- Share of seniors among total labor force Japan 1980-2021
- Labor force participation rate in Malaysia 2021, by marital status and gender
- Youth unemployment rate in Pakistan 2005-2016
- Youth unemployment share in Qatar 2008-2021
- Labor force participation rate in Malaysia 2012-2021
- Workforce numbers in Fujairah in the UAE 2011-2017
- Workforce numbers in Ras Al Khaima in the UAE 2011-2017
- Workforce numbers in Umm Al Quwain in the UAE 2011-2017
- Workforce numbers in Ajman in the UAE 2011-2017
- Youth's labor force participation rate South Korea 2011-2021
Further Content: You might find this interesting as well
Statistics
- Labor force in the U.S. in 2017, by generation
- Number of people in the labor force Canada 2022, by province
- Number of Aboriginals and Torres Strait Islanders unemployed Australia FY 2015 by age
- Selected difficulties finding work indigenous people Australia FY 2015 by age
- Share of employed people aged 65 years or older South Korea 1998-2020
- Share of seniors among total labor force Japan 1980-2021
- Labor force participation rate in Malaysia 2021, by marital status and gender
- Youth unemployment rate in Pakistan 2005-2016
- Youth unemployment share in Qatar 2008-2021
- Labor force participation rate in Malaysia 2012-2021
- Workforce numbers in Fujairah in the UAE 2011-2017
- Workforce numbers in Ras Al Khaima in the UAE 2011-2017
- Workforce numbers in Umm Al Quwain in the UAE 2011-2017
- Workforce numbers in Ajman in the UAE 2011-2017
- Youth's labor force participation rate South Korea 2011-2021
US Department of Labor. (January 22, 2021). Labor force participation rate in the United States in 2020, by age and sex [Graph]. In Statista. Retrieved March 30, 2023, from https://www.statista.com/statistics/800846/labor-force-participation-rate-by-age-and-sex-us/
US Department of Labor. "Labor force participation rate in the United States in 2020, by age and sex." Chart. January 22, 2021. Statista. Accessed March 30, 2023. https://www.statista.com/statistics/800846/labor-force-participation-rate-by-age-and-sex-us/
US Department of Labor. (2021). Labor force participation rate in the United States in 2020, by age and sex. Statista. Statista Inc.. Accessed: March 30, 2023. https://www.statista.com/statistics/800846/labor-force-participation-rate-by-age-and-sex-us/
US Department of Labor. "Labor Force Participation Rate in The United States in 2020, by Age and Sex." Statista, Statista Inc., 22 Jan 2021, https://www.statista.com/statistics/800846/labor-force-participation-rate-by-age-and-sex-us/
US Department of Labor, Labor force participation rate in the United States in 2020, by age and sex Statista, https://www.statista.com/statistics/800846/labor-force-participation-rate-by-age-and-sex-us/ (last visited March 30, 2023)
Labor force participation rate in the United States in 2020, by age and sex [Graph], US Department of Labor, January 22, 2021. [Online]. Available: https://www.statista.com/statistics/800846/labor-force-participation-rate-by-age-and-sex-us/