

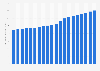


Share of private consumption expenditure on durable goods across India FY 2012-2016
In fiscal year 2016, expenditure on durable goods amounted to around 3.3 percent of the total private consumption expenditure in India. The expenditure share was an increase from the previous year. Share of private consumption expenditure on services contributed the most to the total consumption expenditure in 2016.


