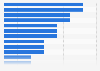
Favorability of Super Bowl halftime show in the U.S. 2022, by generation

Share of adults who liked or disliked the Super Bowl LVI halftime show as of Febuary 2022, by generation

Loading statistic...
Download
Show detailed source information?
Register for free
Already a member?
Log in
Source

Use Ask Statista Research Service

Release date

February 2022

Region

United States

Survey time period

February 14, 2022

Number of respondents

1,423 respondents

Age group

18 years and older

Special properties

adults who said they watched some or all of Super Bowl LVI

Method of interview

Online survey

Supplementary notes

Respondents were asked if they liked the Super Bowl LVI halftime show.

Missing percentage points to 100 percent are probably due to rounding.

Citation formats
Statista Accounts: Access All Statistics. Starting from $2,388 USD / Year
Basic Account
Get to know the platform

You only have access to basic statistics.

Starter Account
The ideal entry-level account for individual users
  • Instant access to 1m statistics
  • Download in XLS, PDF & PNG format
  • Detailed references
$199 USD / Month *
Professional Account
Full access

Business Solutions including all features.

* Prices do not include sales tax.

Other statistics that may interest you

Other statistics that may interest you Statistics on

About the industry

10

About the region

10

Other regions

10

Related statistics

9

Further related statistics

3
Statista Accounts: Access All Statistics. Starting from $2,388 USD / Year
Learn more about how Statista can support your business.