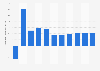
Current plus capital receipts and payments to GDP ratio in India FY 2015-2023
In fiscal year 2023, the current receipts and payments plus capital receipts and payments to GDP ratio in India was over 96 percent. This was an increase from 97.6 percent in the previous fiscal year.