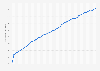
This statistic displays the average total direct taxes and employees' national insurance contribution (NIC) paid by non-retired households in the United Kingdom (UK) in 2017/18, by decile. Households in the top decile paid, on average, 33,741 British pounds, this was the highest total direct taxes and employees' (NIC) paid by any decile group, whilst households in the bottom decile paid, on average, 1,899 British pounds, which was the lowest total direct taxes and employees' (NIC) paid by any decile group.
Average total direct taxes and employees' national insurance contribution (NIC) paid by non-retired households in the United Kingdom (UK) in 2017/18, by decile (in GBP)
Loading statistic...
Basic Account
Get to know the platform
You only have access to basic statistics.
Single Account
The ideal entry-level account for individual users
- Instant access to 1m statistics
- Download in XLS, PDF & PNG format
- Detailed references
$59 $39 / Month *
in the first 12 months
Corporate Account
Full access
Corporate solution including all features.
* Prices do not include sales tax.
Further Content: You might find this interesting as well
Statistics
- Average total direct taxes and employees' NIC in the UK in 2017/18, by decile
- Average direct taxes and employees' NIC per household in the UK 2017/18, by source
- Average child benefit received by non-retired households UK, by decile 2018
- Average student support of non-retired households, by decile UK 2018
- Average income tax paid by of non-retired households UK in 2017/18, by decile
- Share of households with self-employed chief breadwinner, by decile UK 2018
- Average direct cash benefits of non-retired households in the UK, by source
- Share of households where the chief breadwinner was unemployed UK, by decile
- U.S. households: Blu-ray capable device ownership Q4 2010-Q4 2011
- U.S. households: number of VOD movies ordered in past 30 days (as of Q1 2009)
- African-American household's average shopping basket size by store type 2014
Office for National Statistics (UK). (February 26, 2019). Average total direct taxes and employees' national insurance contribution (NIC) paid by non-retired households in the United Kingdom (UK) in 2017/18, by decile (in GBP) [Graph]. In Statista. Retrieved March 04, 2021, from https://www.statista.com/statistics/814517/average-total-direct-taxes-paid-by-non-retired-households-uk/
Office for National Statistics (UK). "Average total direct taxes and employees' national insurance contribution (NIC) paid by non-retired households in the United Kingdom (UK) in 2017/18, by decile (in GBP)." Chart. February 26, 2019. Statista. Accessed March 04, 2021. https://www.statista.com/statistics/814517/average-total-direct-taxes-paid-by-non-retired-households-uk/
Office for National Statistics (UK). (2019). Average total direct taxes and employees' national insurance contribution (NIC) paid by non-retired households in the United Kingdom (UK) in 2017/18, by decile (in GBP). Statista. Statista Inc.. Accessed: March 04, 2021. https://www.statista.com/statistics/814517/average-total-direct-taxes-paid-by-non-retired-households-uk/
Office for National Statistics (UK). "Average Total Direct Taxes and Employees' National Insurance Contribution (Nic) Paid by Non-retired Households in The United Kingdom (Uk) in 2017/18, by Decile (in Gbp)." Statista, Statista Inc., 26 Feb 2019, https://www.statista.com/statistics/814517/average-total-direct-taxes-paid-by-non-retired-households-uk/
Office for National Statistics (UK), Average total direct taxes and employees' national insurance contribution (NIC) paid by non-retired households in the United Kingdom (UK) in 2017/18, by decile (in GBP) Statista, https://www.statista.com/statistics/814517/average-total-direct-taxes-paid-by-non-retired-households-uk/ (last visited March 04, 2021)