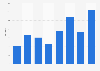
This statistic depicts the net profit generated by the Brazilian paper company Klabin in 2015 and 2016. In 2016, Klabin's net profit amounted to nearly 886 million U.S. dollars, up from a net loss of over 281 million dollars a year earlier.
Net profit of Klabin in Brazil in 2015 and 2016 (in million U.S. dollars)
Basic Account
Get to know the platform
You only have access to basic statistics.
This statistic is not included in your account.
Starter Account
The ideal entry-level account for individual users
- Instant access to 1m statistics
- Download in XLS, PDF & PNG format
- Detailed references
$189 USD $149 USD / Month *
in the first 12 months
Professional Account
Full access
Business Solutions including all features.
* Prices do not include sales tax.
Other statistics that may interest you Statistics on
About the industry
10
- Premium Statistic Brazil: net sales of Klabin 2013-2016
- Premium Statistic Brazil: headcount at Klabin 2013-2016
- Premium Statistic European pulp and paper industry revenue 2000-2022
- Premium Statistic Net profit of UPM 2012-2022
- Premium Statistic Oji Holdings Corporation net sales FY 2005-2021
- Premium Statistic Oji Holdings Corporation total assets FY 2005-2021
- Premium Statistic Oji Holdings Corporation number of employees FY 2005-2021
- Basic Statistic E-commerce value of paper manufacturing shipments in the U.S. 2010-2020
- Basic Statistic Net income of the leading global forestry and paper companies 2021
- Basic Statistic Oji Holdings Corporation sales by business segment 2019-2020
About the region
10
- Premium Statistic Leading paper and cellulose companies in Brazil 2021, by revenue
- Premium Statistic Net profit of Suzano in Brazil 2014-2021
- Premium Statistic Despegar: number of transactions 2019-2022, by market
- Premium Statistic Despegar: share of transactions 2019-2022, by market
- Premium Statistic Magazine Luiza: net income 2016-2022
- Premium Statistic Net revenue of Hypera Pharma in Brazil 2018-2022
- Premium Statistic EBITDA of ALE CombustĂveis in Brazil 2013-2021
- Premium Statistic Net revenue of chemical company Nitro QuĂmica in Brazil 2013-2021
- Basic Statistic Global gross profit of JBS 2013-2021
- Premium Statistic EBITDA of JBS worldwide 2015-2021
Selected statistics
1
Other regions
10
- Premium Statistic Global consumption of paper per capita by region 2016
- Premium Statistic Toilet paper sales value in Italy 2011-2020
- Premium Statistic Nine Dragons Paper's revenue 2015-2021
- Premium Statistic Mexico: number of establishments in stationery manufacturing 2015-2020
- Premium Statistic Number of employees at International Paper 2010-2022
- Basic Statistic PPI of paper and paper products in Vietnam 2015-2022
- Basic Statistic Number of employees in the paper manufacturing industry in Finland 2011-2020
- Basic Statistic Turnover of the paper manufacturing industry in Greece 2011-2020
- Premium Statistic Sales value of manufactured envelopes and letter cards in Malaysia 2019-2022
- Premium Statistic Daio Paper Corporation's total assets FY 2012-2021
Related statistics
9
- Premium Statistic International Paper's revenue 2010-2022
- Basic Statistic International Paper's total assets 2010-2022
- Premium Statistic International Paper's net earnings 2010-2022
- Premium Statistic Share of global paper and paperboard production 2021, by grade
- Premium Statistic Share of global paper and paperboard production 2021, by region
- Premium Statistic Recycling paper imported and exported by CEPI countries 2022, by region
- Basic Statistic Global newsprint paper demand 2021, by region
- Premium Statistic Oji Holdings Corporation net income FY 2005-2019
- Premium Statistic Production of bleached paperboard in the U.S. 2007-2019
Further related statistics
10
- Total revenue at Bertelsmann SE & Co. KGaA, 2003-2022
- Mondelez International's net revenue distribution worldwide by sector 2022
- Mondelez International's operating income worldwide 2011-2022
- BlackBerry net income/loss 2009-2023
- Net interest income of Deutsche Bank 2006-2022
- The adidas Group's EBITDA worldwide 2000-2022
- Income of the InterContinental Hotels Group 2007-2022
- First Solar's net income FY 2007-2022
- Employees of Banco Santander 2013-2022, by gender
- Profit development of Santander group 2001-2022
Further Content: You might find this interesting as well
Statistics
- Total revenue at Bertelsmann SE & Co. KGaA, 2003-2022
- Mondelez International's net revenue distribution worldwide by sector 2022
- Mondelez International's operating income worldwide 2011-2022
- BlackBerry net income/loss 2009-2023
- Net interest income of Deutsche Bank 2006-2022
- The adidas Group's EBITDA worldwide 2000-2022
- Income of the InterContinental Hotels Group 2007-2022
- First Solar's net income FY 2007-2022
- Employees of Banco Santander 2013-2022, by gender
- Profit development of Santander group 2001-2022
Exame. (August 11, 2017). Net profit of Klabin in Brazil in 2015 and 2016 (in million U.S. dollars) [Graph]. In Statista. Retrieved September 30, 2023, from https://www.statista.com/statistics/820309/klabin-net-profit-brazil/
Exame. "Net profit of Klabin in Brazil in 2015 and 2016 (in million U.S. dollars)." Chart. August 11, 2017. Statista. Accessed September 30, 2023. https://www.statista.com/statistics/820309/klabin-net-profit-brazil/
Exame. (2017). Net profit of Klabin in Brazil in 2015 and 2016 (in million U.S. dollars). Statista. Statista Inc.. Accessed: September 30, 2023. https://www.statista.com/statistics/820309/klabin-net-profit-brazil/
Exame. "Net Profit of Klabin in Brazil in 2015 and 2016 (in Million U.S. Dollars)." Statista, Statista Inc., 11 Aug 2017, https://www.statista.com/statistics/820309/klabin-net-profit-brazil/
Exame, Net profit of Klabin in Brazil in 2015 and 2016 (in million U.S. dollars) Statista, https://www.statista.com/statistics/820309/klabin-net-profit-brazil/ (last visited September 30, 2023)
Net profit of Klabin in Brazil in 2015 and 2016 (in million U.S. dollars) [Graph], Exame, August 11, 2017. [Online]. Available: https://www.statista.com/statistics/820309/klabin-net-profit-brazil/