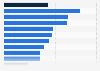
Net operating surplus of private non-financial corporations in the UK 2013-2019
This statistic displays the net operating surplus of private non-financial corporations (PNFCs) in the United Kingdom (UK) from the first quarter of 2013 to the first quarter of 2019. During this period the net operating surplus of PNFCs fluctuated.