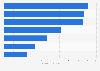
This statistic presents the annual net income generated by ArcelorMittal Brasil S/A from 2013 to 2016. In 2016, the company reported a net loss of 436.1 million U.S. dollars, down from a net income of 441.3 million dollars a year earlier. ArcelorMittal Brasil ranked third among the
Net income of ArcelorMittal in Brazil from 2013 to 2016 (in million U.S. dollars)
Basic Account
Get to know the platform
You only have access to basic statistics.
This statistic is not included in your account.
Starter Account
The ideal entry-level account for individual users
- Instant access to 1m statistics
- Download in XLS, PDF & PNG format
- Detailed references
$199 USD / Month *
Professional Account
Full access
Business Solutions including all features.
* Prices do not include sales tax.
Other statistics that may interest you Statistics on
About the industry
9
- Premium Statistic Brazil: staff at Mineração Usiminas 2013-2016
- Premium Statistic Net revenue of mining company MRN in Brazil 2013-2022
- Premium Statistic Brazil: net revenue of Mineração Curimbaba 2013-2018
- Premium Statistic Brazil: net revenue of metal company Novelis 2013-2017
- Premium Statistic Net revenue of AngloGold in Brazil 2013-2021
- Premium Statistic Net revenue of Hydro Paragominas in Brazil 2013-2021
- Basic Statistic Brazil: net revenue of CSN 2019, by segment
- Premium Statistic Brazil: net revenue of Thyssenkrupp CSA 2013-2016
- Premium Statistic Brazil: net revenue of metal company Vallourec 2013-2017
About the region
10
- Premium Statistic Revenue of Kinross in Brazil 2013-2021
- Premium Statistic Niobium production of CBMM 2021, by product
- Basic Statistic Net profit of the mining company CBMM 2015-2021
- Basic Statistic CBMM's ferroniobium production volume 2015-2021
- Premium Statistic CBMM's ferroniobium export volume in Brazil 2015-2021
- Premium Statistic Water consumption of the mining company CBMM 2009-2021
- Premium Statistic Energy consumption of mining company CBMM 2021, by source
- Premium Statistic Net revenue of the mining company CBMM 2015-2021
- Premium Statistic Greenhouse gas emissions of mining company CBMM 2015-2021
- Premium Statistic CBMM's mining waste 2015-2021, by type
Selected statistics
3
Other regions
10
- Basic Statistic Peru: distribution of mining conflicts 2017, by region
- Basic Statistic Number of mining conflicts in Latin America 2022, by country
- Premium Statistic Codelco's copper production 2010-2022
- Premium Statistic Gross output of the U.S. mining industry 2000-2022
- Basic Statistic Africa's manganese production share worldwide 2018, by country
- Premium Statistic Production of crude steel in the UAE 2014-2022
- Premium Statistic Production of crude steel in the Middle East by country 2022
- Premium Statistic Production of crude steel in Saudi Arabia 2014-2022
- Premium Statistic Production of crude steel in Qatar 2014-2019
- Premium Statistic Leading mining countries worldwide 2023, based on brand value
Related statistics
10
- Premium Statistic Brazil: steel sales of CSN 2016-2019, by product
- Premium Statistic Brazil: net revenue of metal company CSN 2014-2019
- Basic Statistic Brazil: CSN steel sales 2018, by market
- Premium Statistic Brazil: net revenue of metal company Hydro Alunorte 2013-2017
- Premium Statistic Brazil: net revenue of metal company CBA 2013-2017
- Premium Statistic Brazil: net revenue of metal recycling company ReciclaBR 2015-2017
- Premium Statistic Brazil: net revenue of Tramontina Cutelaria 2013-2017
- Premium Statistic AHMSA: volume of steel products sold 2015-2018
- Premium Statistic AHMSA: liquid steel production 2012-2018
- Premium Statistic Brazil: net revenue of Termomecânica 2013-2017
Further related statistics
10
- Rio Tinto's uranium production 2010-2023
- Rio Tinto's diamond production 2010-2023
- Agnico-Eagle Mines' gold reserves 2000-2022
- Glencore's net income 2010-2023
- Glencore's sales of energy products 2010-2023
- Number of Rio Tinto's employees 2010-2023
- Rio Tinto's net income 2001-2023
- Rio Tinto's aluminum and copper production 2010-2023
- Agnico-Eagle Mines' average gold price realized 2010-2022
- Freeport-McMoRan's revenue 2010-2023
Further Content: You might find this interesting as well
Statistics
- Rio Tinto's uranium production 2010-2023
- Rio Tinto's diamond production 2010-2023
- Agnico-Eagle Mines' gold reserves 2000-2022
- Glencore's net income 2010-2023
- Glencore's sales of energy products 2010-2023
- Number of Rio Tinto's employees 2010-2023
- Rio Tinto's net income 2001-2023
- Rio Tinto's aluminum and copper production 2010-2023
- Agnico-Eagle Mines' average gold price realized 2010-2022
- Freeport-McMoRan's revenue 2010-2023
Exame. (August 8, 2017). Net income of ArcelorMittal in Brazil from 2013 to 2016 (in million U.S. dollars) [Graph]. In Statista. Retrieved April 18, 2024, from https://www.statista.com/statistics/859376/brazil-arcelormittal-net-income/
Exame. "Net income of ArcelorMittal in Brazil from 2013 to 2016 (in million U.S. dollars)." Chart. August 8, 2017. Statista. Accessed April 18, 2024. https://www.statista.com/statistics/859376/brazil-arcelormittal-net-income/
Exame. (2017). Net income of ArcelorMittal in Brazil from 2013 to 2016 (in million U.S. dollars). Statista. Statista Inc.. Accessed: April 18, 2024. https://www.statista.com/statistics/859376/brazil-arcelormittal-net-income/
Exame. "Net Income of Arcelormittal in Brazil from 2013 to 2016 (in Million U.S. Dollars)." Statista, Statista Inc., 8 Aug 2017, https://www.statista.com/statistics/859376/brazil-arcelormittal-net-income/
Exame, Net income of ArcelorMittal in Brazil from 2013 to 2016 (in million U.S. dollars) Statista, https://www.statista.com/statistics/859376/brazil-arcelormittal-net-income/ (last visited April 18, 2024)
Net income of ArcelorMittal in Brazil from 2013 to 2016 (in million U.S. dollars) [Graph], Exame, August 8, 2017. [Online]. Available: https://www.statista.com/statistics/859376/brazil-arcelormittal-net-income/