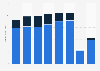
Gender distribution of behind-the-scenes roles in independent features 2018
This graph shows the distribution of behind-the-scenes roles in independent feature films in the United States from 2008 to 2018, by gender. In 2017-18, approximately 29 percent of all behind-the-scenes jobs (such as director, writer, cinematographer) were given to women, while 71 percent of jobs were given to men.