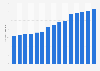
Number of visitors to the Terengganu Marine Park Malaysia 2000-2017
This statistic shows the number of visitors to the maritime national park in Terengganu, Malaysia from 2000 to 2017. The number of visitors to the maritime national park in Terengganu amounted to approximately 362.79 thousand in 2017.