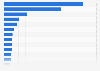
Annual spending on mobile internet access in the Netherlands 2012-2016
The statistic displays the annual spending on mobile internet access in the Netherlands from 2012 to 2016, with a forecast for 2017 to 2021 (in million euros). As of 2016, the annual spending on mobile broadband in the Netherlands was just under two billion euros and had increased steadily from roughly 1.3 billion in 2012. The annual spending on mobile internet access between 2017 and 2021 was forecast to continue to grow at a similar rate to reach just over 2.7 billion euros by the end of the ten year period.