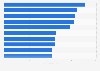
This statistic illustrates the preferred live video streaming content in Italy in 2018. According to survey results, 56 percent of respondents has streamed TV series, while 35 percent of them rather watched sporting games and tutorial videos.
What types of content do you typically live video stream?
Profit from the additional features of your individual account
Currently, you are using a shared account. To use individual functions (e.g., mark statistics as favourites, set
statistic alerts) please log in with your personal account.
If you are an admin, please authenticate by logging in again.
Statista Accounts:
Access All Statistics. Starting from $468 / Year
Learn more about how Statista can support your business.
IAB. (June 13, 2018). What types of content do you typically live video stream? [Graph]. In Statista. Retrieved May 16, 2022, from https://www.statista.com/statistics/871629/preferred-live-video-streaming-content-in-italy/
IAB. "What types of content do you typically live video stream?." Chart. June 13, 2018. Statista. Accessed May 16, 2022. https://www.statista.com/statistics/871629/preferred-live-video-streaming-content-in-italy/
IAB. (2018). What types of content do you typically live video stream?. Statista. Statista Inc.. Accessed: May 16, 2022. https://www.statista.com/statistics/871629/preferred-live-video-streaming-content-in-italy/
IAB. "What Types of Content Do You Typically Live Video Stream?." Statista, Statista Inc., 13 Jun 2018, https://www.statista.com/statistics/871629/preferred-live-video-streaming-content-in-italy/
IAB, What types of content do you typically live video stream? Statista, https://www.statista.com/statistics/871629/preferred-live-video-streaming-content-in-italy/ (last visited May 16, 2022)