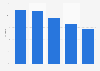
In 2019, the cable TV and broadband EBITDA margin of StarHub was assumed to be valued at 17.9 percent. According to the source, StarHub is the second largest of the three telecom operators in Singapore. The company provides mobile services, pay TV, fixed broadband and fixed voice services, popularly known as quadruple play services.
Cable TV earnings before interest, taxes, depreciation and amortization (EBITDA) margin of StarHub in Singapore from 2018 to 2018, with forecasts for 2020 to 2022
Basic Account
Get to know the platform
You only have access to basic statistics.
This statistic is not included in your account.
Starter Account
The ideal entry-level account for individual users
- Instant access to 1m statistics
- Download in XLS, PDF & PNG format
- Detailed references
$189 USD $149 USD / Month *
in the first 12 months
Professional Account
Full access
Business Solutions including all features.
* Prices do not include sales tax.
Other statistics that may interest you Statistics on
About the industry
10
- Premium Statistic EBITDA margin of Singtel Singapore 2019-2020
- Premium Statistic Mobile EBITDA margin of StarHub Singapore 2018-2019
- Premium Statistic EBITDA growth of telecommunication companies in Singapore 2017
- Basic Statistic Operating revenue of Singtel Ltd FY 2016-2023
- Premium Statistic Revenue distribution of Starhub Limited FY 2021
- Premium Statistic Fixed network EBITDA margin of StarHub Singapore 2018-2019
- Premium Statistic Revenue distribution of Singtel Ltd FY 2020
- Premium Statistic Operating revenue distribution of M1 Singapore 2017
- Basic Statistic Revenue distribution of NetLink NBN Trust Singapore 2017
- Premium Statistic Share of FTTH subscribers Japan 2023, by carrier
About the region
10
- Premium Statistic Number of residential fibre-based connections in Singapore FY 2018-2023
- Premium Statistic Number of non residential fibre-based connections in Singapore 2018-2023
- Premium Statistic Singapore: number of fixed broadband subscriptions 2000-2021
- Premium Statistic Internet data price trend in Singapore 2017-2019
- Basic Statistic Fixed broadband subscriptions per 100 inhabitants in Singapore 2000-2021
- Premium Statistic Customer satisfaction with fixed broadband providers Singapore 2018 by provider
- Premium Statistic Market share of broadband subscribers in Singapore 2016
- Premium Statistic Number of mobile broadband connections per 100 inhabitants in Singapore 2013-2028
- Premium Statistic Rate of broadband usage of businesses in Singapore 2017-2019
- Premium Statistic Top internet activities using fixed broadband in Singapore 2018
Other regions
10
- Premium Statistic Frontier Communications number of video/broadband subscribers 2014-2022
- Premium Statistic South Africa: number of fixed broadband subscriptions 2002-2021
- Basic Statistic Algeria: number of fixed broadband subscriptions 2003-2021
- Basic Statistic Iran: number of fixed broadband subscriptions 2000-2021
- Premium Statistic Mobile broadband subscriptions in Mexico 2011-2021
- Basic Statistic Mobile broadband subscription rate in Russia 2016-2021
- Basic Statistic Number of mobile broadband subscriptions in Paraguay 2010-2021
- Premium Statistic Indonesia: number of fixed broadband subscriptions 2000-2021
- Premium Statistic Revenue of the telecommunications industry in Denmark 2014-2021, by sector
- Premium Statistic Philippines: number of fixed broadband subscriptions 2001-2021
Related statistics
10
- Premium Statistic Most popular video streaming services in Singapore 2017
- Premium Statistic StarHub Limited's total revenue FY 2016-2022
- Premium Statistic XL Axiata's number of subscribers 2014-2022
- Premium Statistic XL Axiata's number of prepaid subscribers 2014-2022
- Premium Statistic XL Axiata's number of postpaid subscribers 2014-2022
- Premium Statistic XL Axiata's number of employees 2014-2022
- Premium Statistic XL Axiata's total traffic 2014-2022
- Basic Statistic Corporate/residential wired broadband subscribers Singapore 2013-2022
- Premium Statistic Residential wired broadband penetration rate in Singapore 2015-2022
- Premium Statistic Daily time spent using online media in Singapore 2022, by activity
Further related statistics
10
- Lumen Technologies (formerly CenturyLink) operating income worldwide 2012-2022
- Arsenal FC revenue 2008-2022, by stream
- Liverpool FC revenue 2008-2022, by stream
- Tottenham Hotspur revenue 2008-2022, by stream
- Schalke 04 revenue by stream 2019/20
- Brazil: fixed broadband lines 2018-2024, by technology
- AS Roma revenue by stream 2015/16
- Total sales of the Richemont Group worldwide 2008-2023
- Revenue of the Bank of Communications 2022
- Ping An Insurance's annual revenue 2012-2022
Further Content: You might find this interesting as well
Statistics
- Lumen Technologies (formerly CenturyLink) operating income worldwide 2012-2022
- Arsenal FC revenue 2008-2022, by stream
- Liverpool FC revenue 2008-2022, by stream
- Tottenham Hotspur revenue 2008-2022, by stream
- Schalke 04 revenue by stream 2019/20
- Brazil: fixed broadband lines 2018-2024, by technology
- AS Roma revenue by stream 2015/16
- Total sales of the Richemont Group worldwide 2008-2023
- Revenue of the Bank of Communications 2022
- Ping An Insurance's annual revenue 2012-2022
DBS Group Research. (December 11, 2020). Cable TV earnings before interest, taxes, depreciation and amortization (EBITDA) margin of StarHub in Singapore from 2018 to 2018, with forecasts for 2020 to 2022 [Graph]. In Statista. Retrieved September 25, 2023, from https://www.statista.com/statistics/888299/singapore-catv-and-broadband-ebitda-margin-of-starhub/
DBS Group Research. "Cable TV earnings before interest, taxes, depreciation and amortization (EBITDA) margin of StarHub in Singapore from 2018 to 2018, with forecasts for 2020 to 2022." Chart. December 11, 2020. Statista. Accessed September 25, 2023. https://www.statista.com/statistics/888299/singapore-catv-and-broadband-ebitda-margin-of-starhub/
DBS Group Research. (2020). Cable TV earnings before interest, taxes, depreciation and amortization (EBITDA) margin of StarHub in Singapore from 2018 to 2018, with forecasts for 2020 to 2022. Statista. Statista Inc.. Accessed: September 25, 2023. https://www.statista.com/statistics/888299/singapore-catv-and-broadband-ebitda-margin-of-starhub/
DBS Group Research. "Cable Tv Earnings before Interest, Taxes, Depreciation and Amortization (Ebitda) Margin of Starhub in Singapore from 2018 to 2018, with Forecasts for 2020 to 2022." Statista, Statista Inc., 11 Dec 2020, https://www.statista.com/statistics/888299/singapore-catv-and-broadband-ebitda-margin-of-starhub/
DBS Group Research, Cable TV earnings before interest, taxes, depreciation and amortization (EBITDA) margin of StarHub in Singapore from 2018 to 2018, with forecasts for 2020 to 2022 Statista, https://www.statista.com/statistics/888299/singapore-catv-and-broadband-ebitda-margin-of-starhub/ (last visited September 25, 2023)
Cable TV earnings before interest, taxes, depreciation and amortization (EBITDA) margin of StarHub in Singapore from 2018 to 2018, with forecasts for 2020 to 2022 [Graph], DBS Group Research, December 11, 2020. [Online]. Available: https://www.statista.com/statistics/888299/singapore-catv-and-broadband-ebitda-margin-of-starhub/