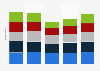
This statistic shows the share of expenses on prevention of retail losses in Chile in 2017. In that year, 43 percent of the surveyed Chilean companies said that they devoted 0.1 to one percent of their revenue to retail losses prevention.
Share of expenses on prevention of retail losses in Chile in 2017
Loading statistic...
Basic Account
Get to know the platform
You only have access to basic statistics.
Starter Account
The ideal entry-level account for individual users
- Instant access to 1m statistics
- Download in XLS, PDF & PNG format
- Detailed references
$199 USD / Month *
Professional Account
Full access
Business Solutions including all features.
* Prices do not include sales tax.
Other statistics that may interest you Statistics on
About the industry
10
- Premium Statistic Main loss prevention systems used by retailers in the U.S. from 2016 to 2020
- Basic Statistic World: share of leading 250 retailers 2021, by region
- Basic Statistic Average loss per shoplifting case in the U.S. from 2014 to 2020
- Basic Statistic Average loss per dishonest employee case in the United States 2014-2020
- Basic Statistic Direct cost of retail crimes committed in the United Kingdom (UK) 2007-2022
- Basic Statistic Share of average loss per dishonest employee case in the U.S. in 2019
- Premium Statistic Share of average loss per shoplifting case in the U.S. in 2019
- Premium Statistic Retail inventory shrinkage in the United States from 2015 to 2018, by source
- Basic Statistic Leading crime-related threats to retailers in the United Kingdom UK) 2013-2015
- Basic Statistic Retail crime: indirect impact in the United Kingdom (UK) 2013-2015
Selected statistics
1
Other regions
10
- Premium Statistic Leading stock exchanges in the Americas 2023, by domestic market capitalization
- Premium Statistic Audience reach of social media sites in Vietnam as of May 2019
- Premium Statistic Largest stock exchange operators in EMEA region 2023, by market capitalization
- Premium Statistic Obesity in the U.S. and Germany
- Premium Statistic Estimated losses due to flooding Canada 2016, by province
- Premium Statistic Malaysia: election gains and losses compared to previous election 2018, by party
- Premium Statistic Scotland: violent crime locations in 2017/18
- Premium Statistic Number of listed companies on stock exchanges in EMEA 2018
- Premium Statistic After-tax profit/loss in carpet, rugs & floor coverings retail in Czechia 2010-2017
- Premium Statistic Share of shoe imports into Algeria by material 2018
Related statistics
5
- Basic Statistic Proportion of organic farms in France 2008-2021
- Basic Statistic Market share of global chocolate manufacturers in the open market 2011/12
- Premium Statistic Share of agricultural land used for organic production in France 2021, by region
- Premium Statistic Total number of shares outstanding Compagnie du Bois Sauvage 2009-2019
- Premium Statistic Sales revenue of Pernod Ricard in France from 2009 to 2013
Further related statistics
10
- Global revenue share of EssilorLuxottica in 2022, by geographical area
- Global oil production share 2010-2022, by region
- Cities with the largest share of parkland in the U.S. 2022
- Sales share of L'Oréal's global cosmetic branch 2022, by geographic zone
- Total number of shares issued by Allianz Group 2009-2022
- Air Liquide's dividend per share 2005-2023
- Production volume of Anheuser-Busch InBev worldwide 2005-2022
- Production volume of Anheuser-Busch InBev by region 2022
- Net income of Dine Brands Global worldwide 2008-2023
- Profit development of Santander group 2001-2023
Further Content: You might find this interesting as well
Statistics
- Global revenue share of EssilorLuxottica in 2022, by geographical area
- Global oil production share 2010-2022, by region
- Cities with the largest share of parkland in the U.S. 2022
- Sales share of L'Oréal's global cosmetic branch 2022, by geographic zone
- Total number of shares issued by Allianz Group 2009-2022
- Air Liquide's dividend per share 2005-2023
- Production volume of Anheuser-Busch InBev worldwide 2005-2022
- Production volume of Anheuser-Busch InBev by region 2022
- Net income of Dine Brands Global worldwide 2008-2023
- Profit development of Santander group 2001-2023
CCS (Centro de Estudios de la Economía Digital). (March 23, 2018). Share of expenses on prevention of retail losses in Chile in 2017 [Graph]. In Statista. Retrieved April 25, 2024, from https://www.statista.com/statistics/894133/chile-budget-retail-loss-prevention-expenses/
CCS (Centro de Estudios de la Economía Digital). "Share of expenses on prevention of retail losses in Chile in 2017." Chart. March 23, 2018. Statista. Accessed April 25, 2024. https://www.statista.com/statistics/894133/chile-budget-retail-loss-prevention-expenses/
CCS (Centro de Estudios de la Economía Digital). (2018). Share of expenses on prevention of retail losses in Chile in 2017. Statista. Statista Inc.. Accessed: April 25, 2024. https://www.statista.com/statistics/894133/chile-budget-retail-loss-prevention-expenses/
CCS (Centro de Estudios de la Economía Digital). "Share of Expenses on Prevention of Retail Losses in Chile in 2017." Statista, Statista Inc., 23 Mar 2018, https://www.statista.com/statistics/894133/chile-budget-retail-loss-prevention-expenses/
CCS (Centro de Estudios de la Economía Digital), Share of expenses on prevention of retail losses in Chile in 2017 Statista, https://www.statista.com/statistics/894133/chile-budget-retail-loss-prevention-expenses/ (last visited April 25, 2024)
Share of expenses on prevention of retail losses in Chile in 2017 [Graph], CCS (Centro de Estudios de la Economía Digital), March 23, 2018. [Online]. Available: https://www.statista.com/statistics/894133/chile-budget-retail-loss-prevention-expenses/