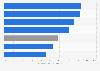
This statistic represents the greenness index of Lahore in Pakistan from 1990 to 2014. In 2014, the greenness index of Lahore amounted to about 0.29, showing an increase of 0.3 compared to the year 2000.
Greenness index of Lahore in Pakistan from 1990 to 2014
Basic Account
Get to know the platform
You only have access to basic statistics.
This statistic is not included in your account.
Starter Account
The ideal entry-level account for individual users
- Instant access to 1m statistics
- Download in XLS, PDF & PNG format
- Detailed references
$189 USD $149 USD / Month *
in the first 12 months
Professional Account
Full access
Business Solutions including all features.
* Prices do not include sales tax.
Other statistics that may interest you Statistics on
About the industry
10
- Premium Statistic Greenness index of Dhaka in Bangladesh 1990-2014
- Premium Statistic Greenness index of Bangkok in Thailand 1990-2014
- Premium Statistic Greenness index of Manila in the Philippines 1990-2014
- Premium Statistic Greenness index of Bangalore in India 1990-2014
- Premium Statistic Greenness index of Mumbai in India 1990-2014
- Premium Statistic Greenness index of Cairo in Egypt1990-2014
- Premium Statistic Greenness index of Jakarta in Indonesia 1990-2014
- Premium Statistic Greenness index of Ho Chi Minh City in Vietnam 1990-2014
- Premium Statistic Ranking of U.S. cities based on clean energy initiatives 2019
- Premium Statistic Share of U.S. buildings with Energy Star certification by key city 2017
About the region
10
- Premium Statistic Population of Lahore in Pakistan 1975-2015
- Premium Statistic Built up area of Lahore in Pakistan 1975-2015
- Premium Statistic Energy consumption from renewables in Pakistan 2005-2015
- Premium Statistic Gross savings in Pakistan 2010-2022
- Premium Statistic Prevalence of smoking for females Pakistan 2000-2020
- Premium Statistic Health expenditure as a share of GDP in Pakistan 2010-2020
- Premium Statistic Prevalence of smoking for males Pakistan 2000-2020
- Premium Statistic Share of children immunized against DPT Pakistan 2012-2021
- Premium Statistic Share of the urban population in Pakistan 2010-2022
- Premium Statistic Value of remittances received in Pakistan 2012-2022
Other regions
10
- Premium Statistic Global Sustainable Cities Planet index by select city 2015
- Premium Statistic Ranking of greenest U.S. cities 2019
- Basic Statistic Share of renewable energy in electricity in Portugal 2007-2018
- Basic Statistic Share of renewable energy in electricity in Germany 2007-2018
- Basic Statistic Share of renewable energy in electricity in Malta 2007-2018
- Basic Statistic Share of renewable energy in electricity in Estonia 2007-2018
- Basic Statistic Share of renewable energy in electricity in Ireland 2007-2018
- Basic Statistic Share of renewable energy in electricity in Austria 2007-2018
- Basic Statistic Share of renewable energy in electricity in Finland 2007-2018
- Basic Statistic Share of renewable energy in electricity in Poland 2007-2018
Related statistics
10
- Premium Statistic Internet penetration rate in Pakistan 2005-2017
- Basic Statistic Production volume of trucks in Pakistan 2008-2019
- Basic Statistic Sales volume of trucks in Pakistan 2008-2019
- Basic Statistic Sales volume of busses in Pakistan 2008-2019
- Basic Statistic Production volume of jeeps and LCV in Pakistan 2008-2019
- Basic Statistic Production volume of pick-up and LCV in Pakistan 2008-2019
- Basic Statistic Sales volume of pick-ups and LCV in Pakistan 2008-2019
- Basic Statistic Production volume of tractors in Pakistan 2008-2019
- Basic Statistic Production volume of passenger cars in Pakistan 2008-2019
- Basic Statistic Production volume of 2/3 wheelers in Pakistan 2008-2019
Further Content: You might find this interesting as well
GHS. (June 21, 2018). Greenness index of Lahore in Pakistan from 1990 to 2014 [Graph]. In Statista. Retrieved September 22, 2023, from https://www.statista.com/statistics/912004/pakistan-greenness-index-lahore/
GHS. "Greenness index of Lahore in Pakistan from 1990 to 2014 ." Chart. June 21, 2018. Statista. Accessed September 22, 2023. https://www.statista.com/statistics/912004/pakistan-greenness-index-lahore/
GHS. (2018). Greenness index of Lahore in Pakistan from 1990 to 2014 . Statista. Statista Inc.. Accessed: September 22, 2023. https://www.statista.com/statistics/912004/pakistan-greenness-index-lahore/
GHS. "Greenness Index of Lahore in Pakistan from 1990 to 2014 ." Statista, Statista Inc., 21 Jun 2018, https://www.statista.com/statistics/912004/pakistan-greenness-index-lahore/
GHS, Greenness index of Lahore in Pakistan from 1990 to 2014 Statista, https://www.statista.com/statistics/912004/pakistan-greenness-index-lahore/ (last visited September 22, 2023)
Greenness index of Lahore in Pakistan from 1990 to 2014 [Graph], GHS, June 21, 2018. [Online]. Available: https://www.statista.com/statistics/912004/pakistan-greenness-index-lahore/