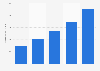
This statistic depicts the total cannabidiol sales in the United States from 2016 and 2017, with expected sales values for 2020 and 2022. In 2018, sales of CBD marijuana amounted to about 177 million U.S. dollars.
Total cannabidiol sales in the United States from 2016 to 2022*, by channel (in million U.S. dollars)
Basic Account
Get to know the platform
You only have access to basic statistics.
This statistic is not included in your account.
Single Account
The ideal entry-level account for individual users
- Instant access to 1m statistics
- Download in XLS, PDF & PNG format
- Detailed references
$59 $39 / Month *
in the first 12 months
Corporate Account
Full access
Corporate solution including all features.
* Prices do not include sales tax.
Further Content: You might find this interesting as well
Statistics
- U.S. total CBD sales 2014 to 2022*, by product type
- Sales of CBD branded products in the United States in 2021, by product type
- Sales of marijuana CBD products in U.S. 2017 to 2022*, by content
- Sales of CBD branded products in U.S. 2017*, by brand
- Sales growth of CBD product brands U.S. 2016-2017*
- Sales price of high-THC and high-CBD products in the United States 2014-2019
- Sales share of CBD branded products in U.S. 2017, by product type
- Sales of hemp-based CBD products U.S. 2014 to 2022*
- Sales share of natural CBD products U.S. 2017/2022*, by product type
- Hemp-based CBD animal and human product sales U.S. 2017/2022*
- Total U.S. cannabidiol (CBD) industry sales by type 2016
- Favorite aspects of CBD products in U.S. and abroad 2017
- CBD pet product market size in the U.S. 2017-2021
- Total U.S. cannabidiol (CBD) product sales 2014-2022
- CBD product sales growth in the United States in 2019, by channel
- Share of veteran medical marijuana users in Canada as of 2018, by dose and gender
- Share of civilian medical marijuana users in Canada as of 2018, by dose and gender
- Cost per gram for medical cannabis from select producers in Canada 2017
- Revenue, expenses and startup costs for medical marijuana dispensaries U.S. 2017
- Canada consumer price of medical cannabis 2010-2017
Hemp Business Journal, & New Frontier Data. (September 1, 2018). Total cannabidiol sales in the United States from 2016 to 2022*, by channel (in million U.S. dollars) [Graph]. In Statista. Retrieved August 08, 2022, from https://www.statista.com/statistics/933558/cbd-sales-channels-us-projection/
Hemp Business Journal, und New Frontier Data. "Total cannabidiol sales in the United States from 2016 to 2022*, by channel (in million U.S. dollars)." Chart. September 1, 2018. Statista. Accessed August 08, 2022. https://www.statista.com/statistics/933558/cbd-sales-channels-us-projection/
Hemp Business Journal, New Frontier Data. (2018). Total cannabidiol sales in the United States from 2016 to 2022*, by channel (in million U.S. dollars). Statista. Statista Inc.. Accessed: August 08, 2022. https://www.statista.com/statistics/933558/cbd-sales-channels-us-projection/
Hemp Business Journal, and New Frontier Data. "Total Cannabidiol Sales in The United States from 2016 to 2022*, by Channel (in Million U.S. Dollars)." Statista, Statista Inc., 1 Sep 2018, https://www.statista.com/statistics/933558/cbd-sales-channels-us-projection/
Hemp Business Journal & New Frontier Data, Total cannabidiol sales in the United States from 2016 to 2022*, by channel (in million U.S. dollars) Statista, https://www.statista.com/statistics/933558/cbd-sales-channels-us-projection/ (last visited August 08, 2022)