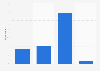
This statistic shows the total number of small and medium enterprises (SMEs) in the Brussels Capital Region (Belgium) in 2020, by number of employees. The SME sector in Belgium is called KMO (an abbreviation of kleine of middelgrote ondernemingen). As of 2020, there were approximately 1.2 million SMEs in the country. This statistic shows that the majority of the SME in Brussels did not have any additional personnel, next to the company owner. In comparison, just under 1,000 SME had between 20 and 49 employees.
Total number of small and medium enterprises (SMEs) in the Brussels Capital Region (Belgium) in 2020, by number of employees
Basic Account
Get to know the platform
You only have access to basic statistics.
This statistic is not included in your account.
Starter Account
The ideal entry-level account for individual users
- Instant access to 1m statistics
- Download in XLS, PDF & PNG format
- Detailed references
$59 USD $39 USD / Month *
in the first 12 months
Professional Account
Full access
Business Solutions including all features.
* Prices do not include sales tax.
Statistics on SME financing in the Benelux
Overview
5
- Premium Statistic Number of SMEs in Belgium 2007-2020
- Premium Statistic Number of SMEs in Flanders, Wallonia and Brussels (Belgium) 2007-2020
- Basic Statistic Number of SMEs in the Netherlands 2008-2021, by size
- Premium Statistic Ranking of ease of access to loans for SMEs in the Benelux region 2019, by country
- Premium Statistic Ranking of venture capital availability in the Benelux region 2019, by country
Belgium
8
- Premium Statistic Interest rate of business loans to SMEs in Belgium 2007-2018
- Premium Statistic Outstanding SME business loans in Belgium 2007-2018
- Basic Statistic Use of bank loans for SMEs in Belgium 2020
- Basic Statistic Value of the most recent bank loan of SMEs in Belgium 2020, by loan size
- Basic Statistic Use of credit line, bank overdraft or credit overdraft of SMEs in Belgium 2020
- Basic Statistic Use of leasing or hire-purchase for SMEs in Belgium 2020
- Basic Statistic Relevance of debt financing for SMEs in Belgium 2014-2020
- Premium Statistic Growth capital and venture capital value in Belgium 2007-2018
Netherlands
8
- Premium Statistic Interest rate of business loans to SMEs in the Netherlands 2007-2020
- Premium Statistic Outstanding business loans from SMEs in the Netherlands 2013-2018
- Basic Statistic Use of bank loans for SMEs in the Netherlands 2020
- Basic Statistic Value of the most recent bank loan of SMEs in the Netherlands 2020, by loan size
- Basic Statistic Use of credit line, bank overdraft or credit overdraft of SMEs in Netherlands 2020
- Basic Statistic Use of leasing or hire-purchase for SMEs in the Netherlands 2020
- Basic Statistic Relevance of debt financing for SMEs in the Netherlands 2014-2020
- Premium Statistic Growth capital and venture capital value in the Netherlands 2007-2018
Luxembourg
8
- Premium Statistic Interest rate of business loans to SMEs in Luxembourg 2007-2018
- Premium Statistic Outstanding business loans from SMEs in Luxembourg 2007-2020
- Premium Statistic Use of bank loans for SMEs in Luxembourg 2021
- Basic Statistic Use of credit line, bank overdraft or credit overdraft of SMEs in Luxembourg 2020
- Basic Statistic Use of leasing or hire-purchase for SMEs in Luxembourg 2020
- Basic Statistic Relevance of debt financing for SMEs in Luxembourg 2014-2020
- Premium Statistic Growth capital and venture capital value in Luxembourg 2007-2018
- Premium Statistic Growth capital and venture capital change in Luxembourg 2008-2018
Further related statistics
15
- Italy: revenue growth rate of small and medium enterprises (SMEs) 2015-2017
- Italy: SMEs' investments as a percentage of tangible assets 2007-2017
- Share of companies in decline in Italy 2015-2020, by size
- ROE of small and medium enterprises in Italy 2016-2020
- Italy: ROE of small and medium enterprises 2017, by degree of international exposure
- Small and medium companies in decline in Italy 2015-2020
- Revenue growth rate of enterprises in Italy 2017-2020, by size
- Italy: CAGR of SMEs 2007-2015, by level of innovation investment
- Return on assets (ROA) in Italy 2015-2018, by company size
- Italy: YoY percentage change in EBITDA of SMEs 2016-2017
- Italy: survival rate of new businesses 2010-2014, by years survived
- Italy: survival rate of new businesses after three years 2010-2012, by sector
- Distribution of SME revenue change in the Netherlands 2017
- Share of SMEs loans requiring collateral in the United Kingdom (UK) 2011-2018
- Distribution of SME profit change in the Netherlands 2017
Further Content: You might find this interesting as well
Statistics
- Italy: revenue growth rate of small and medium enterprises (SMEs) 2015-2017
- Italy: SMEs' investments as a percentage of tangible assets 2007-2017
- Share of companies in decline in Italy 2015-2020, by size
- ROE of small and medium enterprises in Italy 2016-2020
- Italy: ROE of small and medium enterprises 2017, by degree of international exposure
- Small and medium companies in decline in Italy 2015-2020
- Revenue growth rate of enterprises in Italy 2017-2020, by size
- Italy: CAGR of SMEs 2007-2015, by level of innovation investment
- Return on assets (ROA) in Italy 2015-2018, by company size
- Italy: YoY percentage change in EBITDA of SMEs 2016-2017
- Italy: survival rate of new businesses 2010-2014, by years survived
- Italy: survival rate of new businesses after three years 2010-2012, by sector
- Distribution of SME revenue change in the Netherlands 2017
- Share of SMEs loans requiring collateral in the United Kingdom (UK) 2011-2018
- Distribution of SME profit change in the Netherlands 2017
UNIZO , & Graydon, & UCM Mouvement . (January 6, 2022). Total number of small and medium enterprises (SMEs) in the Brussels Capital Region (Belgium) in 2020, by number of employees [Graph]. In Statista. Retrieved March 29, 2023, from https://www.statista.com/statistics/935924/number-of-smes-in-the-brussels-capital-region-belgium-by-number-of-employees/
UNIZO , und Graydon, und UCM Mouvement . "Total number of small and medium enterprises (SMEs) in the Brussels Capital Region (Belgium) in 2020, by number of employees." Chart. January 6, 2022. Statista. Accessed March 29, 2023. https://www.statista.com/statistics/935924/number-of-smes-in-the-brussels-capital-region-belgium-by-number-of-employees/
UNIZO , Graydon, UCM Mouvement . (2022). Total number of small and medium enterprises (SMEs) in the Brussels Capital Region (Belgium) in 2020, by number of employees. Statista. Statista Inc.. Accessed: March 29, 2023. https://www.statista.com/statistics/935924/number-of-smes-in-the-brussels-capital-region-belgium-by-number-of-employees/
UNIZO , and Graydon, and UCM Mouvement . "Total Number of Small and Medium Enterprises (Smes) in The Brussels Capital Region (Belgium) in 2020, by Number of Employees." Statista, Statista Inc., 6 Jan 2022, https://www.statista.com/statistics/935924/number-of-smes-in-the-brussels-capital-region-belgium-by-number-of-employees/
UNIZO & Graydon & UCM Mouvement , Total number of small and medium enterprises (SMEs) in the Brussels Capital Region (Belgium) in 2020, by number of employees Statista, https://www.statista.com/statistics/935924/number-of-smes-in-the-brussels-capital-region-belgium-by-number-of-employees/ (last visited March 29, 2023)
Total number of small and medium enterprises (SMEs) in the Brussels Capital Region (Belgium) in 2020, by number of employees [Graph], UNIZO , & Graydon, & UCM Mouvement , January 6, 2022. [Online]. Available: https://www.statista.com/statistics/935924/number-of-smes-in-the-brussels-capital-region-belgium-by-number-of-employees/