Reasons to drink coffee in the Netherlands 2018
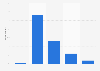
Why do you drink coffee?*

Download
Show detailed source information?
Register for free
Already a member?
Log in
Source

Use Ask Statista Research Service

Release date

October 2018

Region

Netherlands

Survey time period

July 13, 2018 to July 20, 2018

Number of respondents

1,231 respondents

Age group

16 years and older

Special properties

respondents drinking coffee at least once a week

Method of interview

Online survey

Supplementary notes

* The results have been weighted to represent the entire population.

This question was phrased by the source as follows: "Waarom drink jij koffie?" (English: Why do you drink coffee?)

Citation formats
Statista Accounts: Access All Statistics. Starting from $2,388 USD / Year
Basic Account
Get to know the platform

You only have access to basic statistics.
This statistic is not included in your account.

Starter Account
The ideal entry-level account for individual users
  • Instant access to 1m statistics
  • Download in XLS, PDF & PNG format
  • Detailed references
$199 USD / Month *
Professional Account
Full access

Business Solutions including all features.

* Prices do not include sales tax.

Statistics on " Hot drinks market in the Netherlands "

Other statistics that may interest you Hot drinks market in the Netherlands

Hot drinks retail: sales value

6

Hot drinks retail: sales volume

3

Hot drinks retail: expenditure

3

Hot drinks consumption

8

Hot drinks trade

8

Further related statistics

18
Statista Accounts: Access All Statistics. Starting from $2,388 USD / Year
Learn more about how Statista can support your business.