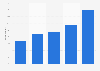
This statistic depicts the results of a survey about the investment behavior of workers across India as of July 2018, by generation. As of this date, around 49 percent of Generation X workers across India stated that they invested in equities and other forms of investment.
Distribution of investment of workers in India as of July 2018, by generation
Basic Account
Get to know the platform
You only have access to basic statistics.
This statistic is not included in your account.
Starter Account
The ideal entry-level account for individual users
- Instant access to 1m statistics
- Download in XLS, PDF & PNG format
- Detailed references
$199 USD / Month *
Professional Account
Full access
Business Solutions including all features.
* Prices do not include sales tax.
Other statistics that may interest you Statistics on
About the industry
10
- Premium Statistic Share of working millennials' investments in India 2018 by income
- Premium Statistic Share of working millennials' investments in India 2018 by gender
- Premium Statistic Share of workers' investments in financial instruments in India 2018 by generation
- Premium Statistic Average size of PE/VC deals in India 2011-2022
- Premium Statistic Median PE/VC deal size India 2011-2022
- Basic Statistic Distribution of investment fund assets in the U.S. 2022, by asset class
- Basic Statistic Investment funds financial assets value in France 2021, by asset type
- Basic Statistic Financial assets of pension funds in Germany in 2021, by asset type
- Premium Statistic Financial assets of pension funds in Netherlands in 2021, by asset type
- Premium Statistic Financial assets of pension funds in Denmark in Q2 2023, by asset type
About the region
9
- Premium Statistic Number of monthly PE/VC funds raised in India 2018-2022
- Premium Statistic Value of PE/VC investments India 2015-2022
- Premium Statistic Number of PE/VC investments in e-commerce sector India 2015-2022
- Premium Statistic PE/VC investment deals in finance services sector in India 2015-2022
- Premium Statistic Value of PE/VC investments in financial services in India 2015-2022
- Premium Statistic Number of PIPE deals in PE/VC investments India from 2014-2021
- Premium Statistic Value of PE/VC monthly funds raised in India 2018-2023
- Premium Statistic Private equity investments in IT and ITeS industry India 2017-2022
- Premium Statistic Private equity investment in telecom industry India 2015-2021
Selected statistics
2
Other regions
10
- Basic Statistic Financial assets of pension funds in Sweden in Q2 2023, by asset type
- Basic Statistic Financial assets of pension funds in Poland 2019-2020, by asset type
- Basic Statistic Investment funds financial assets value in Iceland in 2021, by asset type
- Premium Statistic Change of UHNWIs' asset allocation 2014, by asset class
- Premium Statistic Attitudes towards ethical finance in the United Kingdom (UK) as of 2016
- Basic Statistic Financial assets of pension funds in Slovenia in 2018, by asset type
- Basic Statistic Financial assets of pension funds in Turkey in 2019, by asset type
- Basic Statistic Financial assets of pension funds in Hungary in 2019, by asset type
- Premium Statistic Financial assets of insurance corporations in Italy 2010-2020
- Premium Statistic Fintech investment value in Australia Q1 2018-Q2 2021
Related statistics
10
- Premium Statistic PE/VC investment deals in India by company 2019
- Premium Statistic Private equity investments in agriculture industry India 2017-2019
- Premium Statistic PE/VC investments as share of Indian GDP 2016-2019
- Premium Statistic Leading investment deals by LPS in India 2017
- Premium Statistic Quarterly private equity investment in manufacturing industry in India 2016-2017
- Premium Statistic Investment deal volume in IT and ITES sector in India 2015-2017
- Premium Statistic Opinion on activities by the customers with fintech companies in India 2017 by type
- Premium Statistic Opinion on challenges by incumbents working with fintech companies India 2017 by type
- Premium Statistic Opinion on challenges by companies working with fintech in India 2017 by type
- Premium Statistic Amount of FDI inflow from U.S. to India FY 2013-2023
Further related statistics
10
- Structure of investment portfolio of Allianz Group 2014-2023
- Senior chief financial officer salary per annum in Switzerland 2023
- AstraZeneca's expenditure on research and development 2006-2023
- Foreign exchange earnings from tourism in India 2000-2022
- Number of international tourist arrivals in India 2010-2021
- International tourism receipts of India 2011-2022
- Net revenue from investing and lending at Goldman Sachs 2009-2021
- Financial controller salary per annum in banking in Belgium 2020, by experience
- Per capita consumer spending in India 1974-2012
- Percentage of metals in U.S. municipal solid waste generation 1960-2014
Further Content: You might find this interesting as well
Statistics
- Structure of investment portfolio of Allianz Group 2014-2023
- Senior chief financial officer salary per annum in Switzerland 2023
- AstraZeneca's expenditure on research and development 2006-2023
- Foreign exchange earnings from tourism in India 2000-2022
- Number of international tourist arrivals in India 2010-2021
- International tourism receipts of India 2011-2022
- Net revenue from investing and lending at Goldman Sachs 2009-2021
- Financial controller salary per annum in banking in Belgium 2020, by experience
- Per capita consumer spending in India 1974-2012
- Percentage of metals in U.S. municipal solid waste generation 1960-2014
Livemint. (November 14, 2018). Distribution of investment of workers in India as of July 2018, by generation [Graph]. In Statista. Retrieved April 23, 2024, from https://www.statista.com/statistics/959524/india-investment-behavior-of-workers-by-generation/
Livemint. "Distribution of investment of workers in India as of July 2018, by generation." Chart. November 14, 2018. Statista. Accessed April 23, 2024. https://www.statista.com/statistics/959524/india-investment-behavior-of-workers-by-generation/
Livemint. (2018). Distribution of investment of workers in India as of July 2018, by generation. Statista. Statista Inc.. Accessed: April 23, 2024. https://www.statista.com/statistics/959524/india-investment-behavior-of-workers-by-generation/
Livemint. "Distribution of Investment of Workers in India as of July 2018, by Generation." Statista, Statista Inc., 14 Nov 2018, https://www.statista.com/statistics/959524/india-investment-behavior-of-workers-by-generation/
Livemint, Distribution of investment of workers in India as of July 2018, by generation Statista, https://www.statista.com/statistics/959524/india-investment-behavior-of-workers-by-generation/ (last visited April 23, 2024)
Distribution of investment of workers in India as of July 2018, by generation [Graph], Livemint, November 14, 2018. [Online]. Available: https://www.statista.com/statistics/959524/india-investment-behavior-of-workers-by-generation/