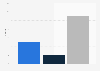
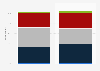
This statistic shows various statements that consumers in France agreed with regarding how balanced/healthy their diet was between 2013 and 2017. Of survey respondents in 2017, 90 percent said they always try to eat a balanced diet.
Consumer attitudes towards a balanced/healthy diet in France from 2013 to 2017
Basic Account
Get to know the platform
You only have access to basic statistics.
This statistic is not included in your account.
Starter Account
The ideal entry-level account for individual users
- Instant access to 1m statistics
- Download in XLS, PDF & PNG format
- Detailed references
$59 USD $39 USD / Month *
in the first 12 months
Professional Account
Full access
Business Solutions including all features.
* Prices do not include sales tax.
Statistics on Diet and body mass index in the United Kingdom (UK)
Overview
8
- Basic Statistic Hospital admissions for obesity in England 2002-2020, by gender
- Basic Statistic Hospital admissions for obesity in England 2019/20, by age
- Basic Statistic England: hospital admissions for obesity 2019/20, by gender and region
- Basic Statistic Number of prescription items for obesity in England 2002-2020
- Basic Statistic Frequency of adult sport participation England 2021
- Premium Statistic Share of adults meeting activity guidelines in Scotland 2021, by gender and age
- Basic Statistic Self-assessed general health status in Scotland 2021, by gender
- Premium Statistic General health status of children in Scotland 2021, by gender
Body mass index
8
- Basic Statistic Mean BMI of individuals in England 1993-2021, by gender
- Basic Statistic Weight classification based on BMI in England 2021 by gender
- Premium Statistic BMI: adult mean body mass index in Scotland 1995-2021, by gender
- Premium Statistic BMI: adult mean body mass index in Scotland 2021, by gender and age
- Premium Statistic BMI: children with an unhealthy body mass index in Scotland 1998-2021, by gender
- Basic Statistic Organ donation population in the United Kingdom (UK) 2021/22, by body mass index
- Premium Statistic England: BMI distribution of women during pregnancy 2018/19, by age group
- Premium Statistic Scotland: BMI distribution of women during pregnancy 2015-2022
Prevalence of overweight and obesity
8
- Basic Statistic Overweight prevalence in England 2000-2021, by gender
- Basic Statistic Obesity prevalence in England 2000-2021, by gender
- Basic Statistic Overweight adults in England 2021, by gender and region
- Basic Statistic Children: overweight and obesity prevalence in England 2019, by gender and age
- Premium Statistic Children aged 10-11 years overweight in England 2020/21, by deprivation decile
- Premium Statistic Children aged 4-5 years overweight in England 2020/21, by deprivation decile
- Premium Statistic Scotland: overweight or obese adults in 2021, by gender and age
- Premium Statistic Children at risk of being overweight/obese in Scotland 1998-2021, by gender
Waist circumference
6
- Basic Statistic Very high waist circumference in England 2019, by gender and age
- Basic Statistic High waist circumference in England 2019, by gender and region
- Basic Statistic Waist circumference in England 2019, by gender and age
- Basic Statistic England: share of adults with very high waist circumference, by gender and income
- Basic Statistic Mean adult waist circumference in Scotland 1995-2018, by gender
- Basic Statistic Share of adults with raised waist circumference in Scotland 1995-2018, by gender
Further related statistics
18
- Distribution of nutritional self-awareness in Germany 2016
- Share of people not eating healthier in Germany in 2017, by reason
- Distribution of nutritional priorities in Germany 2017
- Individuals purchasing healthy food and drink products Europe in 2015, by country
- Changes to eating habits in the United Kingdom (UK) in 2015, by age group
- Most important aspects of healthy eating in the United Kingdom (UK) in 2015
- Areas shoppers are trying to improve in their diet in the United Kingdom (UK) 2015
- Attitudes to healthy foods in Europe in 2015, by country
- Purchasing frequency of fruit and vegetables Europe in 2015, by country
- Attitudes to healthy foods in Europe in 2015
- Attitudes to healthy foods in the United Kingdom (UK) in 2015
- Consumers who aim to eat healthy and nutritious in the U.S. 2016
- Consumers who think healthy eating habits have changed in the U.S. 2016
- Consumers who think healthy eating is important for a healthy life in the U.S. 2016
- Consumers who recently bought food based on labeled ingredients in the U.S. 2016
- Germans who tried superfoods, paleo or clean eating in 2016
- Consumer definitions of healthy menu options in the U.S. as of April 2014
- Pressures on Canadian parents to feed their kids healthy food 2019
Further Content: You might find this interesting as well
Statistics
- Distribution of nutritional self-awareness in Germany 2016
- Share of people not eating healthier in Germany in 2017, by reason
- Distribution of nutritional priorities in Germany 2017
- Individuals purchasing healthy food and drink products Europe in 2015, by country
- Changes to eating habits in the United Kingdom (UK) in 2015, by age group
- Most important aspects of healthy eating in the United Kingdom (UK) in 2015
- Areas shoppers are trying to improve in their diet in the United Kingdom (UK) 2015
- Attitudes to healthy foods in Europe in 2015, by country
- Purchasing frequency of fruit and vegetables Europe in 2015, by country
- Attitudes to healthy foods in Europe in 2015
- Attitudes to healthy foods in the United Kingdom (UK) in 2015
- Consumers who aim to eat healthy and nutritious in the U.S. 2016
- Consumers who think healthy eating habits have changed in the U.S. 2016
- Consumers who think healthy eating is important for a healthy life in the U.S. 2016
- Consumers who recently bought food based on labeled ingredients in the U.S. 2016
- Germans who tried superfoods, paleo or clean eating in 2016
- Consumer definitions of healthy menu options in the U.S. as of April 2014
- Pressures on Canadian parents to feed their kids healthy food 2019
Bord Bia. (August 2, 2017). Consumer attitudes towards a balanced/healthy diet in France from 2013 to 2017 [Graph]. In Statista. Retrieved March 30, 2023, from https://www.statista.com/statistics/984297/france-healthy-diet-behavior/
Bord Bia. "Consumer attitudes towards a balanced/healthy diet in France from 2013 to 2017." Chart. August 2, 2017. Statista. Accessed March 30, 2023. https://www.statista.com/statistics/984297/france-healthy-diet-behavior/
Bord Bia. (2017). Consumer attitudes towards a balanced/healthy diet in France from 2013 to 2017. Statista. Statista Inc.. Accessed: March 30, 2023. https://www.statista.com/statistics/984297/france-healthy-diet-behavior/
Bord Bia. "Consumer Attitudes towards a Balanced/Healthy Diet in France from 2013 to 2017." Statista, Statista Inc., 2 Aug 2017, https://www.statista.com/statistics/984297/france-healthy-diet-behavior/
Bord Bia, Consumer attitudes towards a balanced/healthy diet in France from 2013 to 2017 Statista, https://www.statista.com/statistics/984297/france-healthy-diet-behavior/ (last visited March 30, 2023)
Consumer attitudes towards a balanced/healthy diet in France from 2013 to 2017 [Graph], Bord Bia, August 2, 2017. [Online]. Available: https://www.statista.com/statistics/984297/france-healthy-diet-behavior/