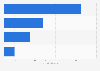
This statistic shows the retail sales value of dietary supplements in Argentina for 2018 as well as a forecast therefor from 2019 to 2023. In 2018, dietary supplements sales in Argentina amounted to 28.45 million U.S. dollars and it was expected to grow up to 39.9 million U.S. dollars by 2023.
Retail sales of dietary supplements in Argentina from 2018 to 2023 (in million U.S. dollars)
Basic Account
Get to know the platform
You only have access to basic statistics.
This statistic is not included in your account.
Starter Account
The ideal entry-level account for individual users
- Instant access to 1m statistics
- Download in XLS, PDF & PNG format
- Detailed references
$69 USD $49 USD / Month *
in the first 12 months
Professional Account
Full access
Business Solutions including all features.
* Prices do not include sales tax.
Other statistics that may interest you
Market overview
6
- Premium Statistic Total global dietary supplements market size 2016-2028
- Premium Statistic Total U.S. dietary supplements market size 2016-2024
- Premium Statistic Total U.S. dietary supplements market size by ingredient 2016-2024
- Premium Statistic Value of the U.S. vitamin and supplement market 2018, by category
- Premium Statistic Unit sales of the U.S. vitamin and supplement market 2018, by category
- Premium Statistic Dietary supplement usage among U.S. adults by type 2020
Selected top companies
4
Supplement users
6
- Premium Statistic Dietary supplement usage in U.S. adults 2008-2021
- Premium Statistic Dietary supplement usage in U.S. adults by age 2020
- Basic Statistic Dietary supplement usage in U.S. adults by gender 2020
- Basic Statistic Dietary supplement usage in U.S. adults by education 2020
- Basic Statistic Dietary supplement usage in U.S. adults by region 2019
- Basic Statistic Dietary supplement usage in U.S. adults by healthy habits 2021
COVID-19 effects
5
- Basic Statistic Top dietary supplement usage growth due to COVID in U.S. adults 2020
- Basic Statistic Dietary supplement usage change due to COVID in U.S. adults by age 2020
- Basic Statistic Dietary supplement usage change due to COVID in U.S. adults by child status 2020
- Basic Statistic Dietary supplement usage change due to COVID in U.S. adults by gender 2020
- Basic Statistic Healthy lifestyle habits during COVID-19 by dietary supplement usage U.S. 2020
Economic impact
6
- Premium Statistic Employment contribution U.S. dietary supplement industry 2016
- Premium Statistic Direct impact of the dietary supplement industry on the U.S. job market in 2016
- Basic Statistic Indirect impact of the dietary supplement industry on the U.S. job market in 2016
- Premium Statistic Wages generated as direct impact of U.S. dietary supplement industry in 2016
- Premium Statistic Wages generated as indirect impact of U.S. dietary supplement industry in 2016
- Premium Statistic Tax impact of the U.S. dietary supplement industry in 2016
Focus: cannabidiol (CBD) supplements
6
- Premium Statistic Consumer interest in cannabis-infused product purchase U.S. 2019, by generation
- Premium Statistic Retail purchase channels of CBD products 2019
- Premium Statistic CBD product c-store sales in the United States in 2022, by segment
- Premium Statistic CBD product grocery store sales in the United States in 2019, by segment
- Premium Statistic C-store sales of leading CBD brands in the United States in 2022
- Premium Statistic Grocery store product leading brands in the United States in 2019
Further related statistics
16
- Mexico: dietary supplements revenue 2017-2022
- Start of dietary supplement usage in U.S. adults by stage of life 2013
- Most widely consumed vitamin/mineral/supplement brands Australia 2015/2016
- Most consumed health products Taiwan as of April 2017
- Top 5 sport nutrition or weight loss supplement types used by U.S. adults 2017
- Sales value of dietary supplements and vitamins in Sweden 2010-2020
- Places to purchase dietary supplements among U.S. adults 2016
- Top 5 herbal and botanical supplement types used by U.S. adults 2017
- Top mineral supplements brands in the United States by sales 2016-2017
- Preferred dietary supplements among French consumers by type of tablet 2018
- Mexico: market share dietary supplements 2018, by company
- Retail expenditure on personal and household care products Saudi Arabia 2018-2025
- Retail expenditure on accessories Saudi Arabia 2018-2025
- Retail expenditure on home appliances Saudi Arabia 2018-2025
- Retail expenditure on consumer electronics Saudi Arabia 2018-2025
- Retail sales of the biggest ice cream companies in Canada 2017
Further Content: You might find this interesting as well
Statistics
- Mexico: dietary supplements revenue 2017-2022
- Start of dietary supplement usage in U.S. adults by stage of life 2013
- Most widely consumed vitamin/mineral/supplement brands Australia 2015/2016
- Most consumed health products Taiwan as of April 2017
- Top 5 sport nutrition or weight loss supplement types used by U.S. adults 2017
- Sales value of dietary supplements and vitamins in Sweden 2010-2020
- Places to purchase dietary supplements among U.S. adults 2016
- Top 5 herbal and botanical supplement types used by U.S. adults 2017
- Top mineral supplements brands in the United States by sales 2016-2017
- Preferred dietary supplements among French consumers by type of tablet 2018
- Mexico: market share dietary supplements 2018, by company
- Retail expenditure on personal and household care products Saudi Arabia 2018-2025
- Retail expenditure on accessories Saudi Arabia 2018-2025
- Retail expenditure on home appliances Saudi Arabia 2018-2025
- Retail expenditure on consumer electronics Saudi Arabia 2018-2025
- Retail sales of the biggest ice cream companies in Canada 2017
NutraIngredients-latam.com. (March 21, 2019). Retail sales of dietary supplements in Argentina from 2018 to 2023 (in million U.S. dollars) [Graph]. In Statista. Retrieved June 07, 2023, from https://www.statista.com/statistics/992421/dietary-supplements-sales-argentina/
NutraIngredients-latam.com. "Retail sales of dietary supplements in Argentina from 2018 to 2023 (in million U.S. dollars)." Chart. March 21, 2019. Statista. Accessed June 07, 2023. https://www.statista.com/statistics/992421/dietary-supplements-sales-argentina/
NutraIngredients-latam.com. (2019). Retail sales of dietary supplements in Argentina from 2018 to 2023 (in million U.S. dollars). Statista. Statista Inc.. Accessed: June 07, 2023. https://www.statista.com/statistics/992421/dietary-supplements-sales-argentina/
NutraIngredients-latam.com. "Retail Sales of Dietary Supplements in Argentina from 2018 to 2023 (in Million U.S. Dollars)." Statista, Statista Inc., 21 Mar 2019, https://www.statista.com/statistics/992421/dietary-supplements-sales-argentina/
NutraIngredients-latam.com, Retail sales of dietary supplements in Argentina from 2018 to 2023 (in million U.S. dollars) Statista, https://www.statista.com/statistics/992421/dietary-supplements-sales-argentina/ (last visited June 07, 2023)
Retail sales of dietary supplements in Argentina from 2018 to 2023 (in million U.S. dollars) [Graph], NutraIngredients-latam.com, March 21, 2019. [Online]. Available: https://www.statista.com/statistics/992421/dietary-supplements-sales-argentina/