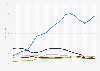
As of May 2021, PAZ led the Russian bus market with over 2.6 new buses sold countrywide during the last period observed. LIAZ and NEFAZ ranked second and third with about 710 and 590 new buses sold, respectively.
Leading bus brands by sales volume in Russia from January 2020 to May 2021 (in 1,000s)
Basic Account
Get to know the platform
You only have access to basic statistics.
This statistic is not included in your account.
Starter Account
The ideal entry-level account for individual users
- Instant access to 1m statistics
- Download in XLS, PDF & PNG format
- Detailed references
$199 USD / Month *
Professional Account
Full access
Business Solutions including all features.
* Prices do not include sales tax.
Other statistics that may interest you Statistics on
About the industry
9
- Premium Statistic New cargo vehicles sales volume in Russia 2020-2021, by manufacturer
- Premium Statistic Leading commercial vehicles sold South Korea 2022
- Premium Statistic Average road traffic volume per electric bus in Norway 2009-2022
- Premium Statistic Road traffic volume of electric buses in Norway 2009-2022
- Premium Statistic Colombia: leading pickup truck models 2021, by registrations
- Premium Statistic Car and truck sales in the United States 2011-2021
- Premium Statistic Electric bus fleet in Norway 2009-2022
- Premium Statistic Number of trucks in use in Sweden 2009-2019
- Premium Statistic Russia: production of heavy trucks from 2014 to 2022
About the region
10
- Premium Statistic Top-10 most sold passenger and commercial car models in Russia Q1 2021-Q1 2023
- Premium Statistic Sales share of new passenger cars and LCVs in Russia 2023, by manufacturer
- Premium Statistic Light commercial vehicles production volume in Russia 2018-2022, by scenario
- Premium Statistic Agricultural machinery sales share in Russia 2021, by segment
- Premium Statistic Structure of road-building machinery sales in Russia 2017
- Premium Statistic Vehicle sales volume in Russia 2005-2022
- Premium Statistic Number of new passenger cars sold in Russia 2012-2027
- Premium Statistic Annual new commercial vehicle sales in Russia 2005-2022
- Premium Statistic Forecast passenger cars production volume in Russia 2018-2021
- Premium Statistic Passenger cars and LCV sales in Russia 2012-2018, by brand origin
Other regions
10
- Premium Statistic Monthly number of new vehicle registrations in Sweden 2019-2020, by type
- Premium Statistic Mexico: number of Volkswagen brand vehicles sold 2016-2019
- Premium Statistic Number of luxury cars in premium segment sold in China 2015-2018
- Premium Statistic Leading electric car models in Norway in 2022
- Premium Statistic Motor vehicle stock in Denmark 2013-2020, by vehicle type
- Basic Statistic Forecast: revenue car & light motor vehicle rent and lease Germany 2009-2020
- Premium Statistic Rental and leasing of cars and light motor vehicles revenue in France 2010-2022
- Premium Statistic Rental and leasing of cars and light motor vehicles revenue in Austria 2010-2022
- Premium Statistic Latin America: best selling car brands 2018
- Basic Statistic Ford's share of the Canadian light truck market - November 2017-2019
Related statistics
10
- Basic Statistic Imports of passenger cars and LCVs to Russia 2012-2019
- Basic Statistic Number of pickups with mileage in Russia 2023, by brand
- Premium Statistic Number of pickups with mileage in Russia in 2023, by region
- Basic Statistic Number of new HCV cars in Russia 2022, by manufacturer
- Basic Statistic Number of HCV cars with mileage in Russia in 2022, by brand
- Basic Statistic Number of HCV cars in Russia 2022, by region
- Premium Statistic Top 10 regions by volume of passenger cars with mileage in Russia 2022
- Premium Statistic Most sold passenger car models in Russia in 2022
- Basic Statistic New LCV car registrations in Russia 2023, by manufacturer
- Premium Statistic New LCV car registrations in Russia 2023, by region
Further related statistics
9
- Cities with the largest share of parkland in the U.S. 2022
- Sales share of L'Oréal's global cosmetic branch 2022, by geographic zone
- Global revenue share of EssilorLuxottica in 2022, by geographical area
- Contribution of China's travel and tourism industry to GDP 2014-2023
- Global oil production share 2010-2022, by region
- China: SAIC auto sales by type 2009-2021
- Revenue of Sinopharm 2011-2022, by category
- Disparities in cigarette consumption in select countries by wealth group 2009
- Global silver supply distribution by source 2014
Further Content: You might find this interesting as well
Statistics
- Cities with the largest share of parkland in the U.S. 2022
- Sales share of L'Oréal's global cosmetic branch 2022, by geographic zone
- Global revenue share of EssilorLuxottica in 2022, by geographical area
- Contribution of China's travel and tourism industry to GDP 2014-2023
- Global oil production share 2010-2022, by region
- China: SAIC auto sales by type 2009-2021
- Revenue of Sinopharm 2011-2022, by category
- Disparities in cigarette consumption in select countries by wealth group 2009
- Global silver supply distribution by source 2014
Russian Automotive Market Research. (August 31, 2022). Leading bus brands by sales volume in Russia from January 2020 to May 2021 (in 1,000s) [Graph]. In Statista. Retrieved April 23, 2024, from https://www.statista.com/statistics/999929/sales-share-of-bus-manufacturers-russia/
Russian Automotive Market Research. "Leading bus brands by sales volume in Russia from January 2020 to May 2021 (in 1,000s)." Chart. August 31, 2022. Statista. Accessed April 23, 2024. https://www.statista.com/statistics/999929/sales-share-of-bus-manufacturers-russia/
Russian Automotive Market Research. (2022). Leading bus brands by sales volume in Russia from January 2020 to May 2021 (in 1,000s). Statista. Statista Inc.. Accessed: April 23, 2024. https://www.statista.com/statistics/999929/sales-share-of-bus-manufacturers-russia/
Russian Automotive Market Research. "Leading Bus Brands by Sales Volume in Russia from January 2020 to May 2021 (in 1,000s)." Statista, Statista Inc., 31 Aug 2022, https://www.statista.com/statistics/999929/sales-share-of-bus-manufacturers-russia/
Russian Automotive Market Research, Leading bus brands by sales volume in Russia from January 2020 to May 2021 (in 1,000s) Statista, https://www.statista.com/statistics/999929/sales-share-of-bus-manufacturers-russia/ (last visited April 23, 2024)
Leading bus brands by sales volume in Russia from January 2020 to May 2021 (in 1,000s) [Graph], Russian Automotive Market Research, August 31, 2022. [Online]. Available: https://www.statista.com/statistics/999929/sales-share-of-bus-manufacturers-russia/