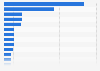
This statistic illustrates the air traffic between Africa and North America between April 2015 and March 2016, by airline region. European carriers accounted for 38 percent of bookings in that time period.
Distribution of bookings for African-North American air traffic from April 2015 to March 2016, by airline region
Basic Account
Get to know the platform
You only have access to basic statistics.
This statistic is not included in your account.
Starter Account
The ideal entry-level account for individual users
- Instant access to 1m statistics
- Download in XLS, PDF & PNG format
- Detailed references
$199 USD / Month *
Professional Account
Full access
Business Solutions including all features.
* Prices do not include sales tax.
Other statistics that may interest you Air transportation worldwide
Overview
5
- Premium Statistic Air traffic - worldwide revenue with passengers 2005-2023
- Premium Statistic Air cargo traffic - worldwide revenue 2004-2022
- Premium Statistic Profit and loss of airlines worldwide 2010-2022
- Premium Statistic Commercial airlines - global EBIT margin 2010-2022
- Basic Statistic Weekly flights change of global airlines due to COVID-19 as of January 2021
Segments
7
- Premium Statistic Global air traffic - annual growth of passenger demand 2006-2024
- Premium Statistic Global air traffic - scheduled passengers 2004-2022
- Premium Statistic Revenue passenger kilometers of airlines - growth by region 2011-2022
- Premium Statistic Air cargo traffic - worldwide volume 2004-2023
- Premium Statistic Monthly freight load factor change in the aviation industry by region 2020-2021
- Premium Statistic Cargo yield of airlines worldwide 2005-2022
- Premium Statistic Air freight rates change since the beginning of COVID-19 outbreak 2019-2022
Airline companies
6
- Premium Statistic COVID-19's impact estimate on passenger revenue of airlines by region 2020
- Premium Statistic Leading airlines ranked by brand value 2023
- Premium Statistic Market value of selected airlines worldwide 2023
- Basic Statistic Leading airlines worldwide based on total number of passengers 2020
- Premium Statistic Passenger kilometers flown by airline worldwide 2020
- Basic Statistic Airlines worldwide - total freight tonne-kilometers 2020
Airports
5
- Premium Statistic Coronavirus: quarterly revenue loss of airports by region 2020-2022
- Premium Statistic Airports with the most international air passenger traffic worldwide 2022
- Premium Statistic Leading airports worldwide based on aircraft movements 2023
- Premium Statistic Worldwide air cargo traffic at airports by region 2020
- Premium Statistic Largest cargo airports worldwide by freight volume 2019-2022
Specialties - aviation safety
4
Further related statistics
10
- U.S. exports - value by transportation mode 2040
- NortonLifeLock: net revenue 2012-2023, by region
- Net sales of GameStop worldwide 2010-2023, by region
- Mondelez International's global workforce by region 2012-2023
- Number of bookings through Booking Holdings worldwide 2010-2023, by segment
- Global oil production share 2010-2022, by region
- Diamond project pipeline worldwide by yearly average production 2016-2020
- Operating profit of SABMiller worldwide 2016, by region
- FIFA World Cup marketing revenue by segment 2013-2015
- Leading European medtech countries based on market capitalization 2014
Further Content: You might find this interesting as well
Statistics
- U.S. exports - value by transportation mode 2040
- NortonLifeLock: net revenue 2012-2023, by region
- Net sales of GameStop worldwide 2010-2023, by region
- Mondelez International's global workforce by region 2012-2023
- Number of bookings through Booking Holdings worldwide 2010-2023, by segment
- Global oil production share 2010-2022, by region
- Diamond project pipeline worldwide by yearly average production 2016-2020
- Operating profit of SABMiller worldwide 2016, by region
- FIFA World Cup marketing revenue by segment 2013-2015
- Leading European medtech countries based on market capitalization 2014
Website (www.airlineleader.com). (August 1, 2016). Distribution of bookings for African-North American air traffic from April 2015 to March 2016, by airline region [Graph]. In Statista. Retrieved June 14, 2024, from https://www.statista.com/statistics/586585/africa-north-america-market-share-bookings/
Website (www.airlineleader.com). "Distribution of bookings for African-North American air traffic from April 2015 to March 2016, by airline region." Chart. August 1, 2016. Statista. Accessed June 14, 2024. https://www.statista.com/statistics/586585/africa-north-america-market-share-bookings/
Website (www.airlineleader.com). (2016). Distribution of bookings for African-North American air traffic from April 2015 to March 2016, by airline region. Statista. Statista Inc.. Accessed: June 14, 2024. https://www.statista.com/statistics/586585/africa-north-america-market-share-bookings/
Website (www.airlineleader.com). "Distribution of Bookings for African-north American Air Traffic from April 2015 to March 2016, by Airline Region." Statista, Statista Inc., 1 Aug 2016, https://www.statista.com/statistics/586585/africa-north-america-market-share-bookings/
Website (www.airlineleader.com), Distribution of bookings for African-North American air traffic from April 2015 to March 2016, by airline region Statista, https://www.statista.com/statistics/586585/africa-north-america-market-share-bookings/ (last visited June 14, 2024)
Distribution of bookings for African-North American air traffic from April 2015 to March 2016, by airline region [Graph], Website (www.airlineleader.com), August 1, 2016. [Online]. Available: https://www.statista.com/statistics/586585/africa-north-america-market-share-bookings/