Consumer adoption of fintech companies and products has grown rapidly in the United Kingdom (UK) between 2015 and 2019. Despite this, usage rates across all fintech categories in the United Kingdom are lower than the global average. In 2019, the most popular fintech service for UK consumers were bank and payment services.
Consumer fintech usage rates in the United Kingdom (UK) in 2019, by category
Basic Account
Get to know the platform
You only have access to basic statistics.
This statistic is not included in your account.
Starter Account
The ideal entry-level account for individual users
- Instant access to 1m statistics
- Download in XLS, PDF & PNG format
- Detailed references
$199 USD / Month *
Professional Account
Full access
Business Solutions including all features.
* Prices do not include sales tax.
Other statistics that may interest you Mobile payments in the United Kingdom (UK)
Market share
6
- Premium Statistic Most used in-store (POS) payment methods in the UK 2017-2023, with 2027 forecast
- Premium Statistic Payments at points of sale by type in the UK 2024
- Premium Statistic Biggest contactless payment brands at POS in the UK 2024
- Premium Statistic Most popular online payment methods in the UK 2022
- Premium Statistic Most popular payment methods for online purchases in the UK 2020
- Premium Statistic Biggest e-commerce payment brands in the UK 2024
Users
4
- Premium Statistic Mobile POS payment penetration rate in 34 countries worldwide 2023
- Premium Statistic Mobile payment adoption in the UK 2016-2020, by age
- Premium Statistic Mobile payments usage by situation in the UK 2024
- Premium Statistic Smartphone ownership in the United Kingdom (UK) 2012-2023, by age
Transaction volume
4
- Premium Statistic Mobile payment market size in 10 countries in Europe in 2020, with a 2025 forecast
- Premium Statistic 
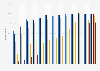
Consumer fintech usage rate in the United Kingdom 2019, by category
- Premium Statistic FinTech Digital Payments transaction value per user in UK 2021-2028, by segment
- Premium Statistic Average carrier billing transaction value in the UK 2019-2021
Brands
5
- Premium Statistic Apple Pay penetration, online and offline, in 19 countries worldwide in Q1 2024
- Premium Statistic Google Pay penetration, online and offline, in 19 countries worldwide in Q1 2024
- Premium Statistic PayPal penetration, online and offline, in 21 countries worldwide in Q1 2024
- Premium Statistic Monthly active users of PayPal app in the UK 2017-2021
- Premium Statistic Monthly active users of the Klarna app in the UK 2018-2021
Mcommerce
4
- Premium Statistic Internet retail: monthly sales value in Great Britain 2016-2023
- Basic Statistic Internet share of retail sales monthly in Great Britain 2018-2023
- Premium Statistic M-commerce retail sales in the UK 2019-2027
- Premium Statistic PoS and e-commerce spending growth in the UK 2022, with a 2026 forecast
Further related statistics
17
- Leading fintech private financing deals globally 2023, by capital raised
- Forecast of use of financial software by the French 2015
- Mexico: fintech adoption rate 2017-2019
- Mexico: fintech adoption rate 2016, by age group
- Mexico: main reasons not to use fintechs 2016
- Mexico: SMEs fintech adoption rate 2019, by category
- Brazil: fintech adoption rate 2017-2019
- Colombia: barriers to financial innovation among fintechs 2018
- Fintech adoption rates globally 2017, by country
- Colombia: most disruptive technologies in the financial sector 2018
- Brazil: main barriers to fintech adoption 2019
- Brazil: fintech services revenue 2017-2022
- French use of financial innovations in 2015, by type
- Fintech investment areas worldwide 2008-2013
- Share of women using scentless primer make-up in Japan 2020, by age
- Share of computer usage among households Thailand 2014-2018
- Trust management market funds growth in Russia 2021, by segment
Further Content: You might find this interesting as well
Statistics
- Leading fintech private financing deals globally 2023, by capital raised
- Forecast of use of financial software by the French 2015
- Mexico: fintech adoption rate 2017-2019
- Mexico: fintech adoption rate 2016, by age group
- Mexico: main reasons not to use fintechs 2016
- Mexico: SMEs fintech adoption rate 2019, by category
- Brazil: fintech adoption rate 2017-2019
- Colombia: barriers to financial innovation among fintechs 2018
- Fintech adoption rates globally 2017, by country
- Colombia: most disruptive technologies in the financial sector 2018
- Brazil: main barriers to fintech adoption 2019
- Brazil: fintech services revenue 2017-2022
- French use of financial innovations in 2015, by type
- Fintech investment areas worldwide 2008-2013
- Share of women using scentless primer make-up in Japan 2020, by age
- Share of computer usage among households Thailand 2014-2018
- Trust management market funds growth in Russia 2021, by segment
EY. (September 9, 2019). Consumer fintech usage rates in the United Kingdom (UK) in 2019, by category [Graph]. In Statista. Retrieved June 10, 2024, from https://www.statista.com/statistics/1055347/fintech-usage-rates-united-kingdom-selected-countries-by-category/
EY. "Consumer fintech usage rates in the United Kingdom (UK) in 2019, by category." Chart. September 9, 2019. Statista. Accessed June 10, 2024. https://www.statista.com/statistics/1055347/fintech-usage-rates-united-kingdom-selected-countries-by-category/
EY. (2019). Consumer fintech usage rates in the United Kingdom (UK) in 2019, by category. Statista. Statista Inc.. Accessed: June 10, 2024. https://www.statista.com/statistics/1055347/fintech-usage-rates-united-kingdom-selected-countries-by-category/
EY. "Consumer Fintech Usage Rates in The United Kingdom (Uk) in 2019, by Category." Statista, Statista Inc., 9 Sep 2019, https://www.statista.com/statistics/1055347/fintech-usage-rates-united-kingdom-selected-countries-by-category/
EY, Consumer fintech usage rates in the United Kingdom (UK) in 2019, by category Statista, https://www.statista.com/statistics/1055347/fintech-usage-rates-united-kingdom-selected-countries-by-category/ (last visited June 10, 2024)
Consumer fintech usage rates in the United Kingdom (UK) in 2019, by category [Graph], EY, September 9, 2019. [Online]. Available: https://www.statista.com/statistics/1055347/fintech-usage-rates-united-kingdom-selected-countries-by-category/