BMW Group's vehicle sales in the United States between the 1st quarter of 2020 and 4th quarter of 2023, by segment (in units)
Basic Account
Get to know the platform
You only have access to basic statistics.
This statistic is not included in your account.
Starter Account
The ideal entry-level account for individual users
- Instant access to 1m statistics
- Download in XLS, PDF & PNG format
- Detailed references
$199 USD / Month *
Professional Account
Full access
Business Solutions including all features.
* Prices do not include sales tax.
Other statistics that may interest you Car brands in the United States
Overview
7
- Premium Statistic Most valuable automotive brands worldwide by brand value 2023
- Premium Statistic Car brand market share worldwide 2023
- Premium Statistic Vehicles in operation in the U.S. Q1 2018-Q1 2023
- Premium Statistic U.S.: Annual car sales 1951-2023
- Premium Statistic Annual U.S. vehicle average spending by income 2021
- Premium Statistic U.S. vehicle sales by major car brands through December 2022
- Premium Statistic Light vehicle market in the United States by brand Q1 2023
Segments
6
- Basic Statistic U.S. vehicle sales of North American car brands Q4 2022 & Q4 2023
- Premium Statistic Vehicle sales of Asian car brands in the United States 2022
- Premium Statistic Vehicle sales of European car brands in the United States 2022
- Basic Statistic Luxury vehicles: United States premium vehicle sales 2022
- Premium Statistic U.S. quarterly hybrid and plug-in hybrid electric vehicle sales by brand 2020-2022
- Premium Statistic U.S. quarterly battery electric vehicle sales by model 2020-2023
Consumers
8
- Premium Statistic Willingness to change car make in the U.S. 2024
- Premium Statistic Satisfaction with car make in the U.S. 2024
- Premium Statistic U.S.: leading factors for consumers when choosing their next vehicle's brand 2022
- Premium Statistic Car brand perception survey in the United States 2023
- Premium Statistic Most reliable car brands for safety according to U.S. car owners 2023
- Premium Statistic Car quality: best brands as ranked by U.S. new car owners 2023
- Premium Statistic U.S. consumer satisfaction: car & light vehicle brands 2023
- Premium Statistic U.S. consumer satisfaction: Ford 2006-2023
Companies
8
- Premium Statistic Toyota Motor Corporation: net revenue 2012-2024
- Basic Statistic Volkswagen Group: revenue by vehicle subsidiary 2015-2023
- Premium Statistic Honda's annual revenue 2002-2024
- Premium Statistic Ford Motor Company: total revenue 2008-2023
- Basic Statistic General Motors Company: revenue 2013-2023
- Premium Statistic Net revenue of Stellantis 2019-2023
- Premium Statistic Global revenue of BMW Group 2007-2023
- Premium Statistic Mercedes-Benz Cars & Vans revenue 2011-2023
Special focus on quarterly sales
8
- Premium Statistic General Motors Company: vehicle sales in the United States by brand Q4 2020-Q4 2023
- Premium Statistic Ford Motor Company: vehicle sales in the United States by segment Q4 2020-Q4 2023
- Premium Statistic Toyota Motor Corporation's quarterly vehicle sales in the U.S. by brand 2020-2023
- Premium Statistic Honda Motor Company: vehicle sales in the United States by segment Q4 2020-Q4 2023
- Premium Statistic Nissan - vehicle sales in the United States by segment Q4 2020 and Q4 2022
- Premium Statistic Hyundai Motor Group's vehicle sales in the U.S. by brand 2020-2022
- Premium Statistic Volkswagen: vehicle sales in the United States by segment Q4 2020-Q4 2022
- Premium Statistic 
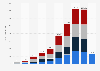
BMW Group: U.S. vehicle sales by segment & quarter 2023
Further related statistics
17
- North America: new passenger vehicle registrations by brand 2013-2016
- South Africa - new passenger vehicle registrations by brand 2014-2016
- Number of BMW cars registered in Italy 2013-2018
- BMW 1 Series cars registered in Great Britain 2004-2018
- BMW 3 Series cars registered in Great Britain 2000-2018
- Worldwide Renault-Nissan Alliance vehicle sales by region 2018
- Mazda - vehicle sales in the United States Q4 2020 - Q4 2022
- South Africa - passenger vehicle sales by manufacturer 2019
- U.S. vehicle sales - North American car brands December 2017-2018
- Mitsubishi - vehicle sales in the United States Q4 2020, Q4 2021 and Q4 2022
- Taiwan - passenger vehicle sales by manufacturer 2016
- Ownership of BMW models in Great Britain 2015-2020, by number of users
- Global deliveries of Bugatti 2014-2022
- BMW's market share in the U.S. Q1 2018-2020
- Vauxhall Insignia cars registered for the first time in Great Britain (UK) 2009-2019
- Number of cars with 201-225g/km CO2 emissions in Great Britain (UK) 2001-2017
- Industry revenue of “Motor vehicle and parts dealers“ in Canada 2012-2024
Further Content: You might find this interesting as well
Statistics
- North America: new passenger vehicle registrations by brand 2013-2016
- South Africa - new passenger vehicle registrations by brand 2014-2016
- Number of BMW cars registered in Italy 2013-2018
- BMW 1 Series cars registered in Great Britain 2004-2018
- BMW 3 Series cars registered in Great Britain 2000-2018
- Worldwide Renault-Nissan Alliance vehicle sales by region 2018
- Mazda - vehicle sales in the United States Q4 2020 - Q4 2022
- South Africa - passenger vehicle sales by manufacturer 2019
- U.S. vehicle sales - North American car brands December 2017-2018
- Mitsubishi - vehicle sales in the United States Q4 2020, Q4 2021 and Q4 2022
- Taiwan - passenger vehicle sales by manufacturer 2016
- Ownership of BMW models in Great Britain 2015-2020, by number of users
- Global deliveries of Bugatti 2014-2022
- BMW's market share in the U.S. Q1 2018-2020
- Vauxhall Insignia cars registered for the first time in Great Britain (UK) 2009-2019
- Number of cars with 201-225g/km CO2 emissions in Great Britain (UK) 2001-2017
- Industry revenue of “Motor vehicle and parts dealers“ in Canada 2012-2024
GoodCarBadCar.net. (January 4, 2024). BMW Group's vehicle sales in the United States between the 1st quarter of 2020 and 4th quarter of 2023, by segment (in units) [Graph]. In Statista. Retrieved June 10, 2024, from https://www.statista.com/statistics/235106/bmw-groups-vehicle-sales-in-the-united-states-by-segment/
GoodCarBadCar.net. "BMW Group's vehicle sales in the United States between the 1st quarter of 2020 and 4th quarter of 2023, by segment (in units)." Chart. January 4, 2024. Statista. Accessed June 10, 2024. https://www.statista.com/statistics/235106/bmw-groups-vehicle-sales-in-the-united-states-by-segment/
GoodCarBadCar.net. (2024). BMW Group's vehicle sales in the United States between the 1st quarter of 2020 and 4th quarter of 2023, by segment (in units). Statista. Statista Inc.. Accessed: June 10, 2024. https://www.statista.com/statistics/235106/bmw-groups-vehicle-sales-in-the-united-states-by-segment/
GoodCarBadCar.net. "Bmw Group's Vehicle Sales in The United States between The 1st Quarter of 2020 and 4th Quarter of 2023, by Segment (in Units)." Statista, Statista Inc., 4 Jan 2024, https://www.statista.com/statistics/235106/bmw-groups-vehicle-sales-in-the-united-states-by-segment/
GoodCarBadCar.net, BMW Group's vehicle sales in the United States between the 1st quarter of 2020 and 4th quarter of 2023, by segment (in units) Statista, https://www.statista.com/statistics/235106/bmw-groups-vehicle-sales-in-the-united-states-by-segment/ (last visited June 10, 2024)
BMW Group's vehicle sales in the United States between the 1st quarter of 2020 and 4th quarter of 2023, by segment (in units) [Graph], GoodCarBadCar.net, January 4, 2024. [Online]. Available: https://www.statista.com/statistics/235106/bmw-groups-vehicle-sales-in-the-united-states-by-segment/