total audience of over 684 thousand spectators in 2022.
In 2022, an average of just over 19 thousand fans watched the games of the NCAA Men's Division I Basketball Tournament live in the arenas. Commonly known as March Madness, the tournament attracted a Average attendance at March Madness games from 2000 to 2022 (in 1,000s)
Loading statistic...
Basic Account
Get to know the platform
You only have access to basic statistics.
Starter Account
The ideal entry-level account for individual users
- Instant access to 1m statistics
- Download in XLS, PDF & PNG format
- Detailed references
$199 USD / Month *
Professional Account
Full access
Business Solutions including all features.
* Prices do not include sales tax.
Other statistics that may interest you Sporting events in the United States
Overview
4
- Premium Statistic Revenue of the sport events industry in the U.S. 2019-2028
- Premium Statistic Number of TV viewers of most watched sporting events in the U.S. 2023
- Premium Statistic Most common sports to watch live in the U.S. 2022
- Premium Statistic Watching frequency of live sport on television in the U.S. 2023
The Super Bowl
5
- Premium Statistic Super Bowl TV viewership in the U.S. 1990-2024
- Premium Statistic NFL Super Bowl halftime show viewers in the U.S. 2024
- Basic Statistic Average cost 30-second advertisement Super Bowl U.S. broadcast 2002-2024
- Basic Statistic Super Bowl attendance in the U.S. 1967-2024
- Basic Statistic Most Super Bowl wins by NFL team 1967-2024
NBA Finals
4
The World Series
5
- Premium Statistic MLB World Series TV viewership in the U.S. 2000-2023
- Premium Statistic MLB World Series attendance 1903-2023
- Basic Statistic MLB: World Series titles won by team 1903-2023
- Basic Statistic Major League Baseball managers by number of World Series won 2023
- Basic Statistic MLB World Series most games by players 2023
The Stanley Cup
4
March Madness
5
- Premium Statistic NCAA championship game TV audience 2013-2024
- Basic Statistic Teams with the most March Madness championship wins in the U.S. 1939-2024
- Premium Statistic NCAA Men's March Madness average TV viewership in the U.S. 2024
- Basic Statistic NCAA men's basketball Final Four viewers in the U.S. 2024
- Basic Statistic 
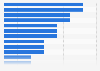
Average attendance at NCAA March Madness games 2000-2022
Further related statistics
10
- College graduation rate , by acceptance rate of U.S. college institution 2013
- Highest earning increase from obtaining a graduate degree in the U.S. 2013
- African-American undergraduate enrollment numbers, by gender 1976 to 2011
- Post-baccalaureate enrollment numbers in the U.S., by institution type 1976-2010
- College majors with the highest participation of Asian students in the U.S. 2009
- U.S. college majors with the highest participation of African-American students 2009
- Median income of arts majors by study focus in the U.S. 2013
- Median income of communications and journalism majors by study focus in the U.S. 2013
- Median income of psychology and social work majors by study focus in the U.S. 2013
- Least popular college majors in the U.S. by gender 2009
Further Content: You might find this interesting as well
Statistics
- College graduation rate , by acceptance rate of U.S. college institution 2013
- Highest earning increase from obtaining a graduate degree in the U.S. 2013
- African-American undergraduate enrollment numbers, by gender 1976 to 2011
- Post-baccalaureate enrollment numbers in the U.S., by institution type 1976-2010
- College majors with the highest participation of Asian students in the U.S. 2009
- U.S. college majors with the highest participation of African-American students 2009
- Median income of arts majors by study focus in the U.S. 2013
- Median income of communications and journalism majors by study focus in the U.S. 2013
- Median income of psychology and social work majors by study focus in the U.S. 2013
- Least popular college majors in the U.S. by gender 2009
National Collegiate Athletic Association. (March 14, 2023). Average attendance at March Madness games from 2000 to 2022 (in 1,000s) [Graph]. In Statista. Retrieved June 18, 2024, from https://www.statista.com/statistics/1374631/march-madness-average-attendance/
National Collegiate Athletic Association. "Average attendance at March Madness games from 2000 to 2022 (in 1,000s)." Chart. March 14, 2023. Statista. Accessed June 18, 2024. https://www.statista.com/statistics/1374631/march-madness-average-attendance/
National Collegiate Athletic Association. (2023). Average attendance at March Madness games from 2000 to 2022 (in 1,000s). Statista. Statista Inc.. Accessed: June 18, 2024. https://www.statista.com/statistics/1374631/march-madness-average-attendance/
National Collegiate Athletic Association. "Average Attendance at March Madness Games from 2000 to 2022 (in 1,000s)." Statista, Statista Inc., 14 Mar 2023, https://www.statista.com/statistics/1374631/march-madness-average-attendance/
National Collegiate Athletic Association, Average attendance at March Madness games from 2000 to 2022 (in 1,000s) Statista, https://www.statista.com/statistics/1374631/march-madness-average-attendance/ (last visited June 18, 2024)
Average attendance at March Madness games from 2000 to 2022 (in 1,000s) [Graph], National Collegiate Athletic Association, March 14, 2023. [Online]. Available: https://www.statista.com/statistics/1374631/march-madness-average-attendance/