OPEC member country by refinery capacities. The country's refinery capacity amounted to some 3.3 million barrels per calendar day that year.
OPEC's refinery capacity presented a trend of growth over the years, despite some fluctuation. In 2022, figures increased to 13 million barrels per day. Saudi Arabia was the leading Annual OPEC refinery capacity from 2010 to 2022 (in 1,000 barrels per calendar day)
Loading statistic...
Basic Account
Get to know the platform
You only have access to basic statistics.
Starter Account
The ideal entry-level account for individual users
- Instant access to 1m statistics
- Download in XLS, PDF & PNG format
- Detailed references
$199 USD / Month *
Professional Account
Full access
Business Solutions including all features.
* Prices do not include sales tax.
Other statistics that may interest you OPEC
Overview
6
- Premium Statistic Global oil production 1998-2022
- Premium Statistic Global oil refinery capacity 1970-2022
- Premium Statistic Global oil consumption 1970-2022
- Premium Statistic Global crude oil export value by country 2022
- Basic Statistic Voluntary oil output cuts by OPEC+ countries 2023
- Basic Statistic OPEC oil demand 2019-2045
Reserves
4
Production and refinery
6
- Premium Statistic OPEC's crude oil production 1998-2022
- Premium Statistic OPEC 's global crude oil production share 2010-2022
- Basic Statistic OPEC natural gas production by country 2012-2022
- Basic Statistic OPEC's global natural gas production share 2010-2022
- Basic Statistic 
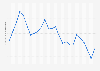
OPEC refinery capacity 2010-2022
- Premium Statistic OPEC refinery capacity 2012-2022, by member state
Prices
4
Trade
5
- Basic Statistic OPEC's net oil export revenue 2021-2024
- Basic Statistic OPEC net oil export revenue streams by country 2022
- Premium Statistic Global crude oil exports by OPEC countries 2012-2022
- Premium Statistic Oil exports from OPEC regions 2021
- Basic Statistic OPEC oil exports 2012-2022, by region
Selected member state profiles
8
- Premium Statistic Algeria's fossil fuels industry select information 2022
- Premium Statistic Angola's fossil fuels industry selected figures 2022
- Premium Statistic Equatorial Guinea's fossil fuels industry selected figures 2022
- Premium Statistic Gabon's fossil fuels industry selected figures 2022
- Premium Statistic Iran's fossil fuels industry select information 2021
- Premium Statistic Iraq's fossil fuels industry select information 2021
- Basic Statistic Kuwait's fossil fuels industry selected figures 2021
- Basic Statistic Libya's fossil fuels industry select information 2022
Further related statistics
19
- Potential and announced refinery closures 2010
- Oil refinery capacity in France 1998-2022
- Dangote oil refinery selected data 2017
- Supply and consumption of gasoline in the Northeast: outlook 2013
- Oil import and refinery receipts in Canada by country 2018
- Oil refinery capacity in Austria 2005-2022
- Oil refinery capacity in Czechia 2005-2022
- Italy: number of refineries 2010-2017
- Canada's refinery run to stills 1986-2018
- Oil refinery capacity in Spain 2005-2022
- Canada's oil refinery CO2 emissions by fuel type 2017
- Crude oil input in the UAE 2010-2019
- Oil refining capacity of Finland 2011-2021
- Oil refinery capacity in Portugal 2005-2022
- Petrochemical and refinery accidents and casualties in Russia 2010-2020
- Capital investment Refining NZ New Zealand FY 2014-2020
- Volume of CO2 produced by Refining NZ New Zealand 2016-2020
- Hydrocarbon fuel usage Refining NZ New Zealand 2014-2020
- Refined copper imports APAC 2021, by country
Further Content: You might find this interesting as well
Statistics
- Potential and announced refinery closures 2010
- Oil refinery capacity in France 1998-2022
- Dangote oil refinery selected data 2017
- Supply and consumption of gasoline in the Northeast: outlook 2013
- Oil import and refinery receipts in Canada by country 2018
- Oil refinery capacity in Austria 2005-2022
- Oil refinery capacity in Czechia 2005-2022
- Italy: number of refineries 2010-2017
- Canada's refinery run to stills 1986-2018
- Oil refinery capacity in Spain 2005-2022
- Canada's oil refinery CO2 emissions by fuel type 2017
- Crude oil input in the UAE 2010-2019
- Oil refining capacity of Finland 2011-2021
- Oil refinery capacity in Portugal 2005-2022
- Petrochemical and refinery accidents and casualties in Russia 2010-2020
- Capital investment Refining NZ New Zealand FY 2014-2020
- Volume of CO2 produced by Refining NZ New Zealand 2016-2020
- Hydrocarbon fuel usage Refining NZ New Zealand 2014-2020
- Refined copper imports APAC 2021, by country
OPEC. (December 14, 2023). Annual OPEC refinery capacity from 2010 to 2022 (in 1,000 barrels per calendar day) [Graph]. In Statista. Retrieved June 16, 2024, from https://www.statista.com/statistics/292543/-opec-refinery-capacity/
OPEC. "Annual OPEC refinery capacity from 2010 to 2022 (in 1,000 barrels per calendar day)." Chart. December 14, 2023. Statista. Accessed June 16, 2024. https://www.statista.com/statistics/292543/-opec-refinery-capacity/
OPEC. (2023). Annual OPEC refinery capacity from 2010 to 2022 (in 1,000 barrels per calendar day). Statista. Statista Inc.. Accessed: June 16, 2024. https://www.statista.com/statistics/292543/-opec-refinery-capacity/
OPEC. "Annual Opec Refinery Capacity from 2010 to 2022 (in 1,000 Barrels per Calendar Day)." Statista, Statista Inc., 14 Dec 2023, https://www.statista.com/statistics/292543/-opec-refinery-capacity/
OPEC, Annual OPEC refinery capacity from 2010 to 2022 (in 1,000 barrels per calendar day) Statista, https://www.statista.com/statistics/292543/-opec-refinery-capacity/ (last visited June 16, 2024)
Annual OPEC refinery capacity from 2010 to 2022 (in 1,000 barrels per calendar day) [Graph], OPEC, December 14, 2023. [Online]. Available: https://www.statista.com/statistics/292543/-opec-refinery-capacity/